

Question: Names BA 3 5 3 : ICE 8 Attach a screenshot of the first ( sim 1 2 ) rows of your
Names
BA : ICE
Attach a screenshot of the first sim rows of your simulation.
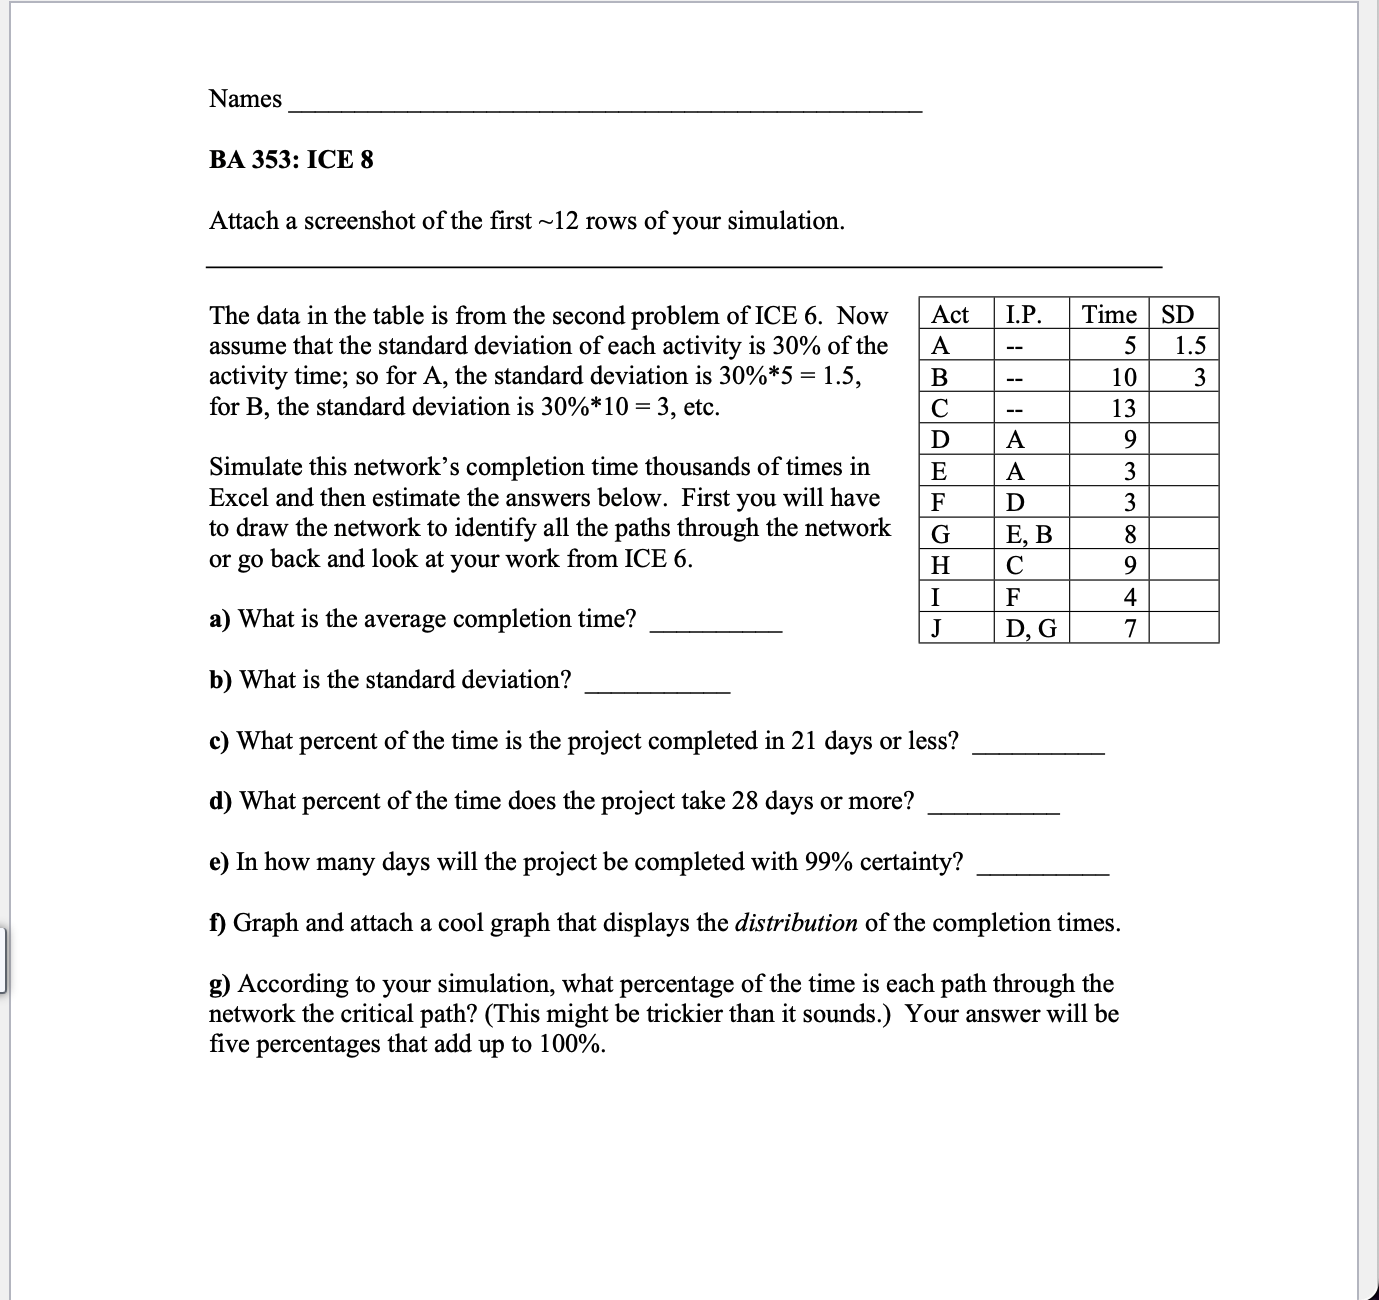
The data in the table is from the second problem of ICE Now assume that the standard deviation of each activity is of the activity time; so for A the standard deviation is for B the standard deviation is etc.
Simulate this network's completion time thousands of times in Excel and then estimate the answers below. First you will have to draw the network to identify all the paths through the network or go back and look at your work from ICE
a What is the average completion time?
b What is the standard deviation?
c What percent of the time is the project completed in days or less?
d What percent of the time does the project take days or more?
e In how many days will the project be completed with certainty?
f Graph and attach a cool graph that displays the distribution of the completion times.
g According to your simulation, what percentage of the time is each path through the network the critical path? This might be trickier than it sounds. Your answer will be five percentages that add up to
Step by Step Solution
There are 3 Steps involved in it
1 Expert Approved Answer
Step: 1 Unlock

Question Has Been Solved by an Expert!
Get step-by-step solutions from verified subject matter experts
Step: 2 Unlock
Step: 3 Unlock