

Question: NATNING FORMATION FOR DECISION MAKING PLANNING, AND CONTROL Case Study 16.1: Superior Hotel-service budget example For ease of presentation, the budget year has been
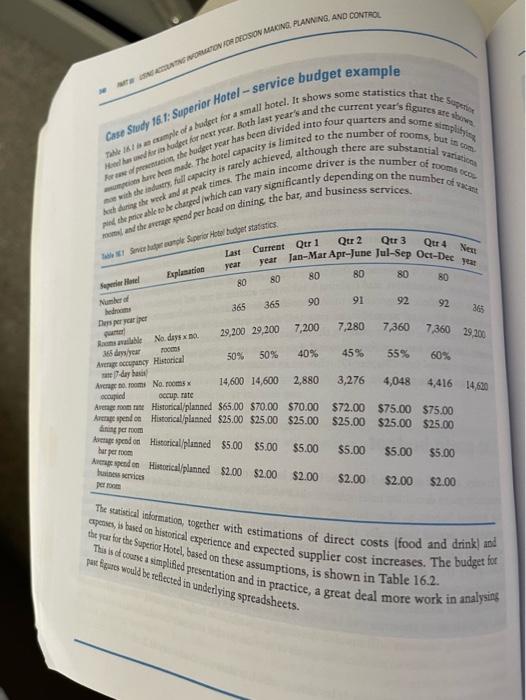
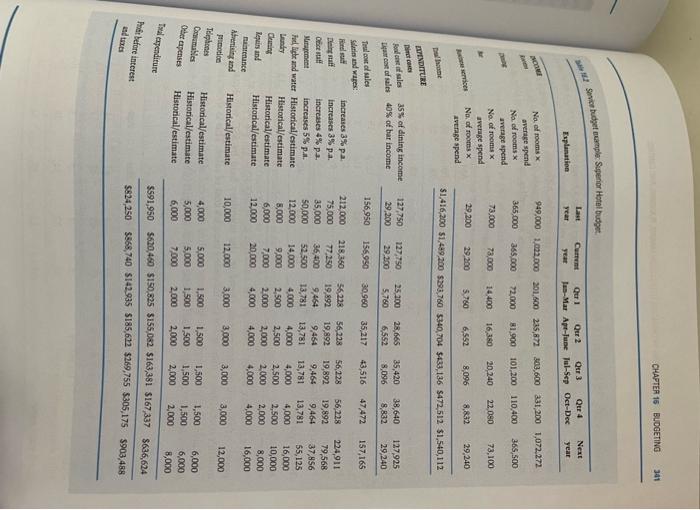
NATNING FORMATION FOR DECISION MAKING PLANNING, AND CONTROL Case Study 16.1: Superior Hotel-service budget example For ease of presentation, the budget year has been divided into four quarters and some simplifying Table 161 is an example of a budget for a small hotel. It shows some statistics that the Superio Hotel has used for its budget for next year. Both last year's and the current year's figures are shows mptions have been made. The hotel capacity is limited to the number of rooms, but in com me with the industry, full capacity is rarely achieved, although there are substantial variations pind the price able to be charged (which can vary significantly depending on the number of vacant both during the week and at peak times. The main income driver is the number of rooms oco mom and the average spend per head on dining, the bar, and business services. Table Server Juter umple Superior Hotel budget statistics Qtr 2 Qtr 3 Qtr 4 Nex year Jan-Mar Apr-June Jul-Sep Oct-Dec year Superior Hotel Last Current Qtr 1 year Explanation 80 80 80 80 80 80 Number of bedrooms 365 365 90 91 92 Days per year per 92 365 per Rooms available 29,200 29,200 No. days x no 7,200 7,280 7,360 365 days/year 70000 7,360 29,200 Average occupancy Historical 50% 50% 40% 45% 55% 60% 7-day basis Average no rooms No. rooms x occupied 14,600 14,600 2,880 3,276 Occup rate 4,048 4,416 14,630 Average room rate Historical/planned $65.00 $70.00 $70.00 $72.00 Average spend on Historical/planned $25.00 $25.00 $25.00 $25.00 dining per room Average spend on Historical/planned $5.00 $5.00 $5.00 bar per room Average spend on Historical/planned $2.00 $2.00 $2.00 business services per room $75.00 $75.00 $25.00 $25.00 $5.00 $5.00 $5.00 $2.00 $2.00 $2.00 The statistical information, together with estimations of direct costs (food and drink) and the year for the Superior Hotel, based on these assumptions, is shown in Table 16.2. expenses, is based on historical experience and expected supplier cost increases. The budget for This is of course a simplified presentation and in practice, a great deal more work in analysing past figures would be reflected in underlying spreadsheets.
Step by Step Solution
There are 3 Steps involved in it

Get step-by-step solutions from verified subject matter experts