

Question: need a & b pls 12. Financial Planning. Managers at Industrial Supply, Inc. are planning a sales campaign for the coming year in which they
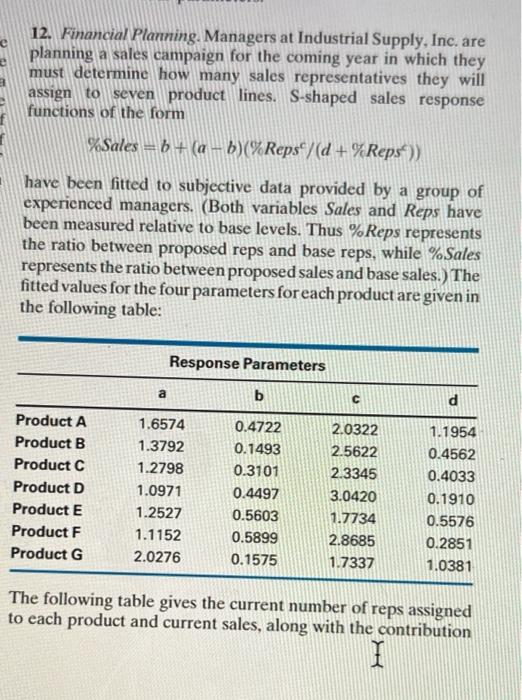
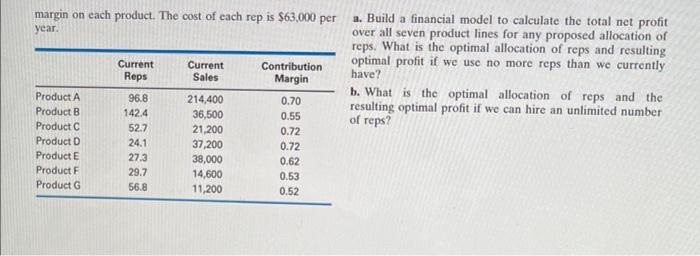
12. Financial Planning. Managers at Industrial Supply, Inc. are planning a sales campaign for the coming year in which they must determine how many sales representatives they will assign to seven product lines. S-shaped sales response functions of the form have been fitted to subjective data provided by a group of experienced managers. (Both variables Sales and Reps have been measured relative to base levels. Thus \% Reps represents the ratio between proposed reps and base reps, while \%Sales represents the ratio between proposed sales and base sales.) The fitted values for the four parameters for each product are given in the following table: The following table gives the current number of reps assigned to each product and current sales, along with the contribution margin on each product. The cost of each rep is $63,000 per a. Build a financial model to calculate the total net profit year. over all seven product lines for any proposed allocation of reps. What is the optimal allocation of reps and resulting optimal profit if we use no more reps than we currently have? b. What is the optimal allocation of reps and the resulting optimal profit if we can hire an unlimited number of reps? 12. Financial Planning. Managers at Industrial Supply, Inc. are planning a sales campaign for the coming year in which they must determine how many sales representatives they will assign to seven product lines. S-shaped sales response functions of the form have been fitted to subjective data provided by a group of experienced managers. (Both variables Sales and Reps have been measured relative to base levels. Thus \% Reps represents the ratio between proposed reps and base reps, while \%Sales represents the ratio between proposed sales and base sales.) The fitted values for the four parameters for each product are given in the following table: The following table gives the current number of reps assigned to each product and current sales, along with the contribution margin on each product. The cost of each rep is $63,000 per a. Build a financial model to calculate the total net profit year. over all seven product lines for any proposed allocation of reps. What is the optimal allocation of reps and resulting optimal profit if we use no more reps than we currently have? b. What is the optimal allocation of reps and the resulting optimal profit if we can hire an unlimited number of reps
Step by Step Solution
There are 3 Steps involved in it

Get step-by-step solutions from verified subject matter experts