

Question: Need a slope triangle along the line but not using the data already plotted. (0,12),(2,10), (4,18),(6,26),(8,34), (10,42),(12,50) Need to find 2 separate points Point A
- Need a slope triangle along the line but not using the data already plotted. (0,12),(2,10), (4,18),(6,26),(8,34), (10,42),(12,50)
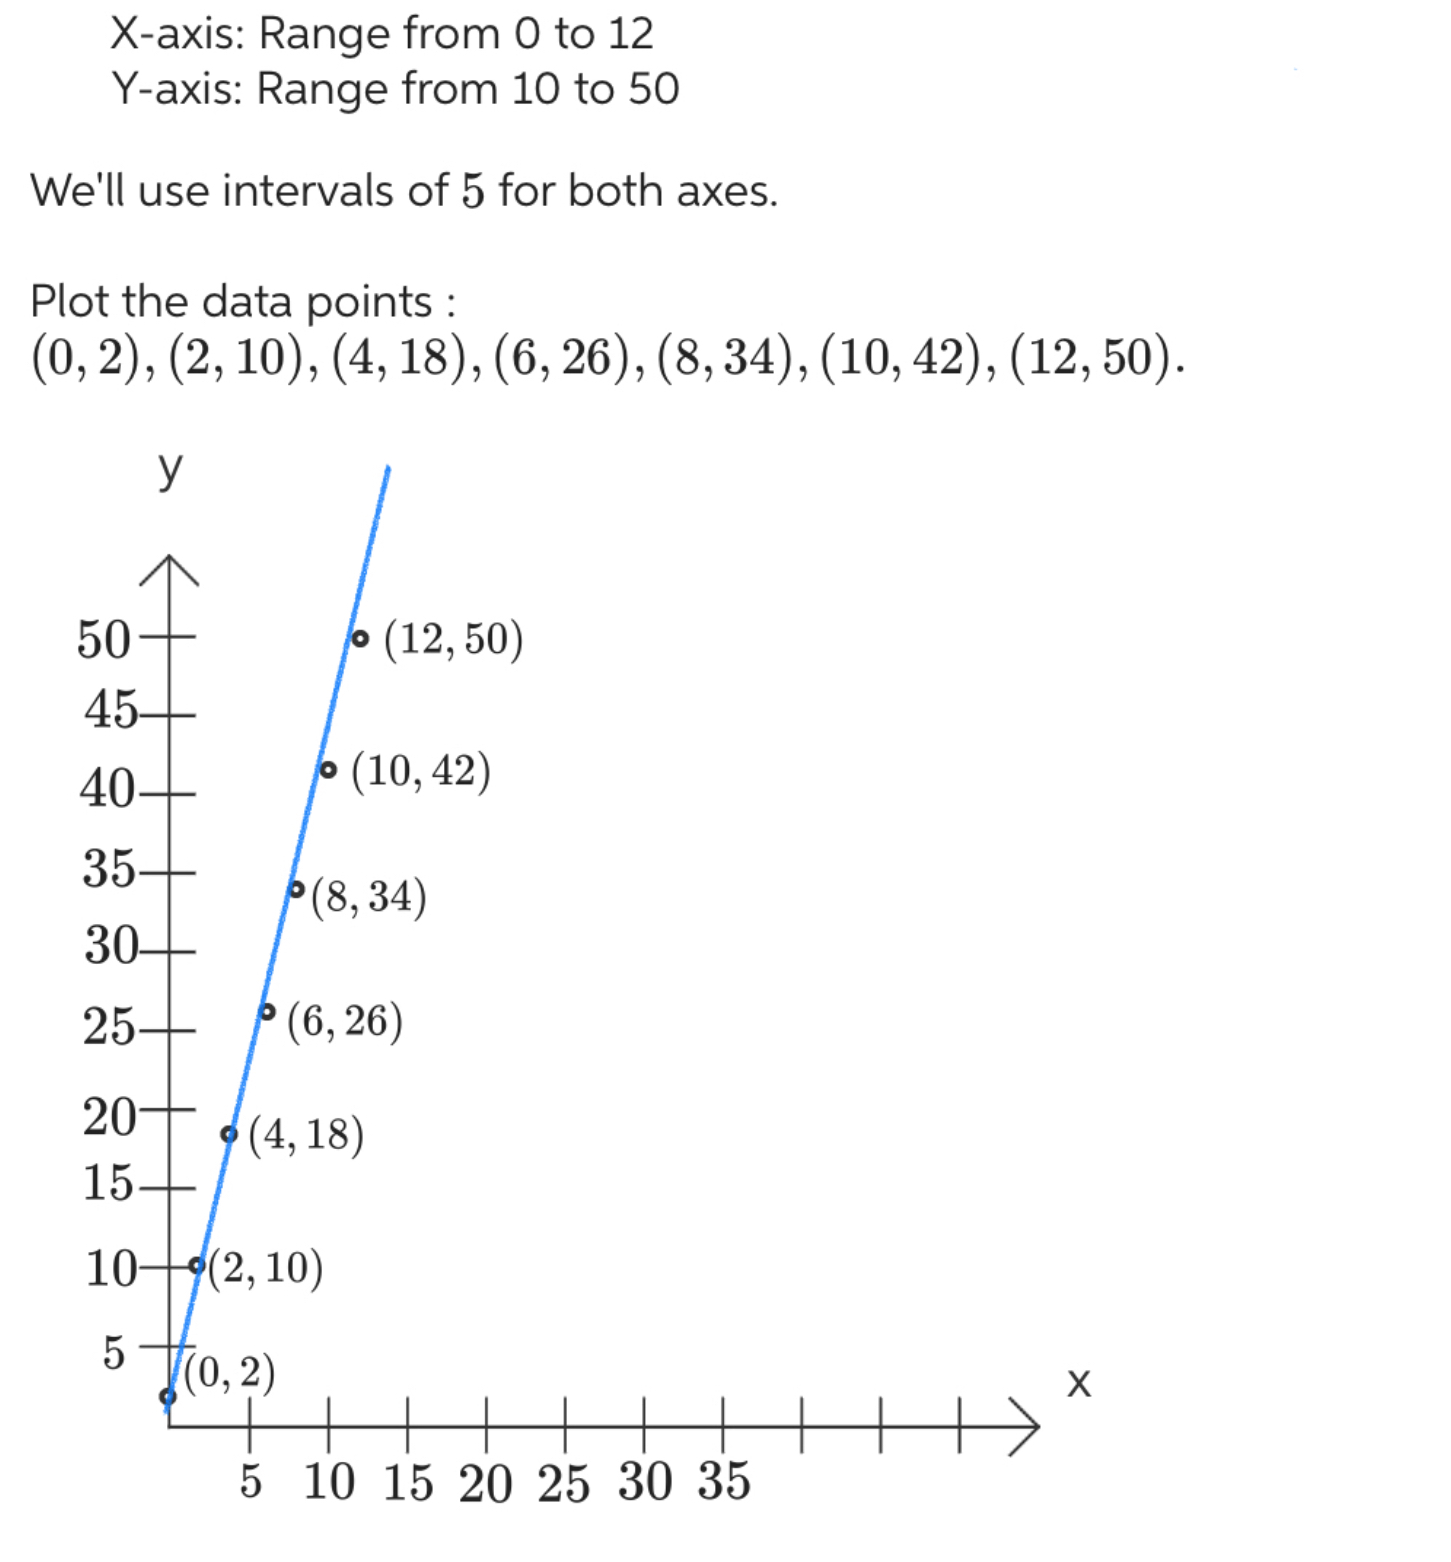
- Need to find 2 separate points Point A (X1, Y1) & Point B (X2 & Y2). Along the line between points (0,2), & (12,50)
- To Find differnce of Y and X of the New 2 Points Use the NEW 2 Set of Coordinates and Plug information into and Use Slope=X2?X1Y2?Y1?
- The Solution from (Y2-Y1)/(X2-X1) Is used in Slope=RUNRISE?
- Find 2 separate points along the line and it cannot be the coordinates that were plotted .
- Need to use 2 NEW coordinates on the line connect the 2 points along the line then sketch a right triangle, going from the first point to the second point.
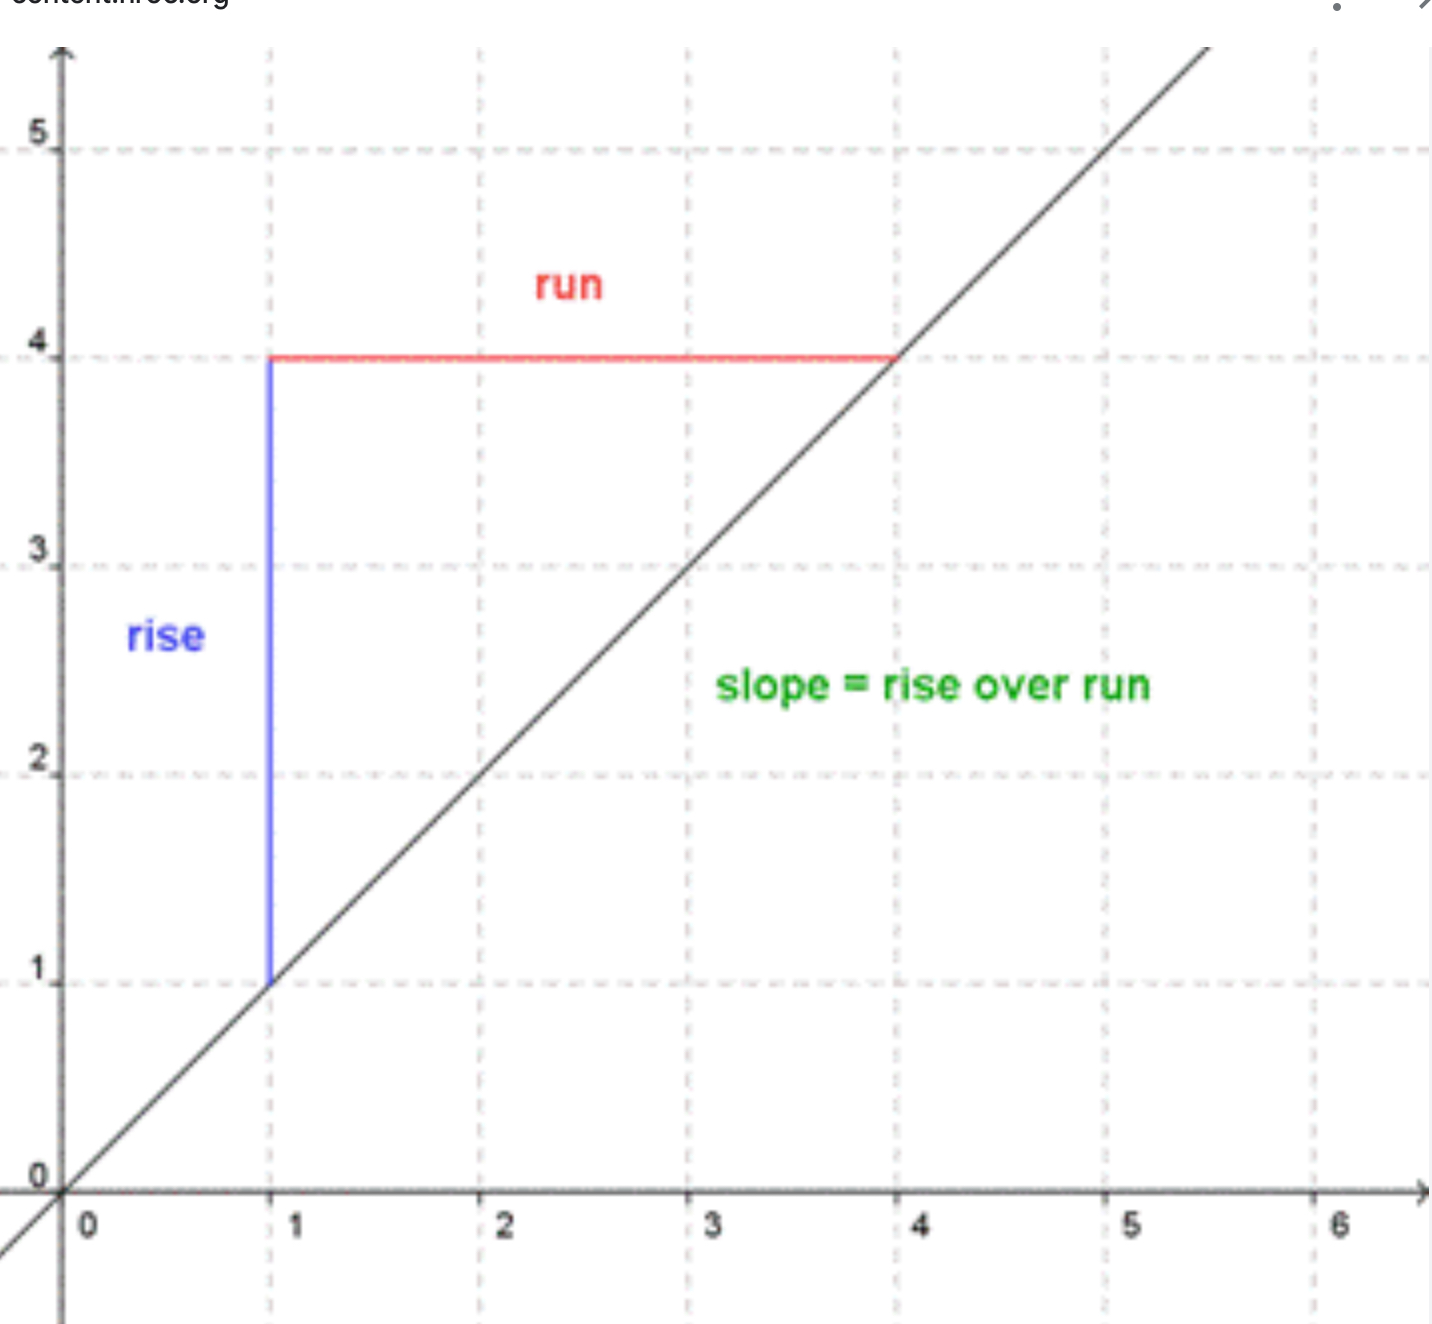
- Count the rise and the run on the legs of the triangle.
- Take the ratio of rise to run to find the slope, M=RUNRISE?
- Label Rise and Run and count how many space vertically the Y-Axis
- Plot the 2 Additional points that is on the line. 2 new points in additio to the data which is the plotted points that that made the line
- these points are between the minimum and maximum. The minimum is (0, 2) & ( 12,50)
- Use the slope formula to identify the rise and the run.
- Starting at the the 1st point choosen count out the rise and run to mark the second point.
- Connect the points with a line.
The Slope of a Line. is m=riserunm=rise/run .
- The rise measures the vertical change
&
- the run measures the horizontal change.
FIND THE SLOPE USING 2 POINTS FROM THE LINE BUT NOT FROM THE DATA TABLE " WHICH MEANS ALONG THE LINE"
PLUG DATA IN AND SOLVE SLOPE OF 2 NEW POINTS ON THE LINE WITH NEW COORDINATES ND FIND RISE AND RUN FOR SLOPE PICTURE #1 GRAPH OF LINE OF PLOTTED DATA COORDINATES
Step by Step Solution
There are 3 Steps involved in it
1 Expert Approved Answer
Step: 1 Unlock

Question Has Been Solved by an Expert!
Get step-by-step solutions from verified subject matter experts
Step: 2 Unlock
Step: 3 Unlock