

Question: need answer and simplest explanation possible please so that i can understand .86.13 The defect rate for data entry of insurance claims has historically been
need answer and simplest explanation possible please so that i can understand 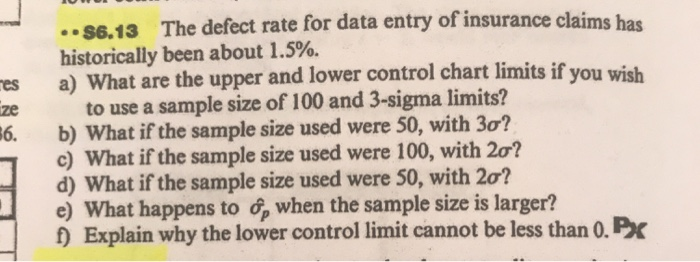
.86.13 The defect rate for data entry of insurance claims has historically been about 1.5%. a) What are the upper and lower control chart limits if you wish to use a sample size of 100 and 3-sigma limits? b) What if the sample size used were 50, with 3o? c) What if the sample size used were 100, with 20? d) What if the sample size used were 50, with 20? e) What happens to , when the sample size is larger? 1) Explain why the lower control limit cannot be less than 0. PX
Step by Step Solution
There are 3 Steps involved in it
1 Expert Approved Answer
Step: 1 Unlock

Question Has Been Solved by an Expert!
Get step-by-step solutions from verified subject matter experts
Step: 2 Unlock
Step: 3 Unlock