

Question: need answer as soon as possible Data was collected from a process under statistical control or developing X-Chart. The collected data is presented in Table
need answer as soon as possible
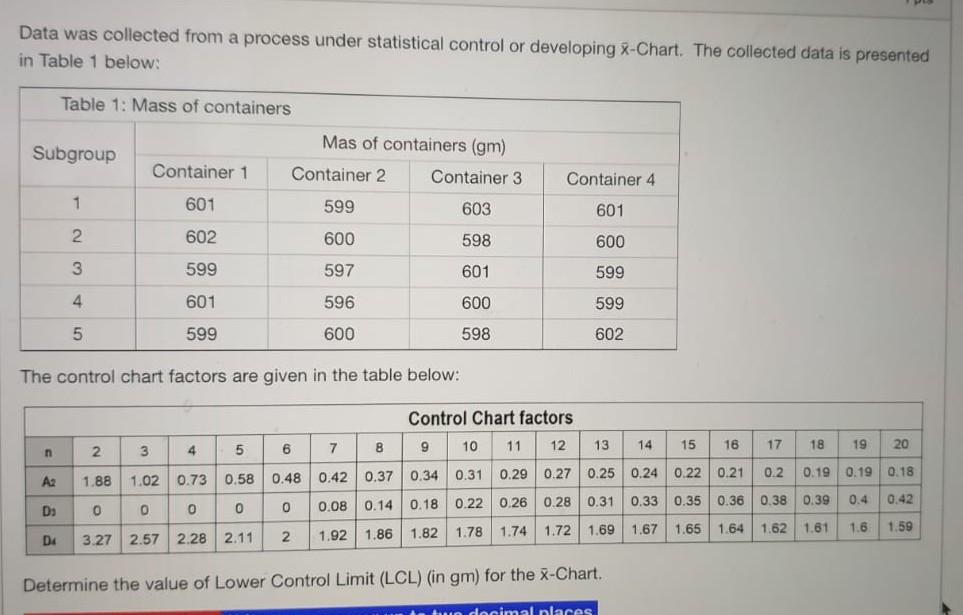
Data was collected from a process under statistical control or developing X-Chart. The collected data is presented in Table 1 below: Table 1: Mass of containers Subgroup Container 1 Mas of containers (gm) Container 2 Container 3 599 603 Container 4 1 601 601 2 602 600 598 600 3 599 597 601 599 4 601 596 600 599 5 599 600 598 602 The control chart factors are given in the table below: Control Chart factors 2 3 6 4 5 7 8 9 10 11 n 12 13 14 15 19 16 20 17 18 . 0.29 i 0.48 0.24 0.37 0.34 0.42 0.31 0.22 0.27 0.25 0.21 0.2 Az 1.88 0.18 1.02 0.73 0.58 0.19 0.19 0.22 0.26 Ds 0.4 0.42 0.28 0.31 0 0.08 0.33 0.35 0.36 0.38 0.39 0 0 0 0 0.14 0.18 1.64 1.6 1.67 1.65 1.59 1.62 1.81 DA 3.27 2.57 2.28 2.11 2. 1.92 1.861.82 1.78 1.74 1.72 1.69 Determine the value of Lower Control Limit (LCL) (in gm) for the X-Chart. decimal placesStep by Step Solution
There are 3 Steps involved in it
1 Expert Approved Answer
Step: 1 Unlock

Question Has Been Solved by an Expert!
Get step-by-step solutions from verified subject matter experts
Step: 2 Unlock
Step: 3 Unlock