

Question: need answer asp no need to show work Anue getting a process into statistical control, a range chart was developed (3-sigmo limits) with LCL=0 and
need answer asp no need to show work 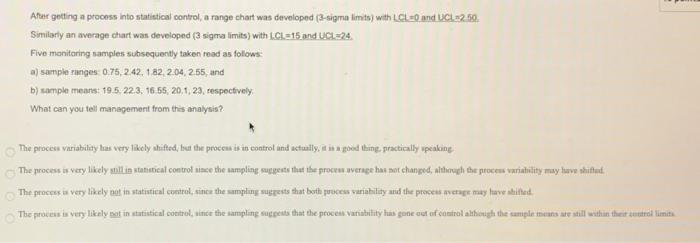
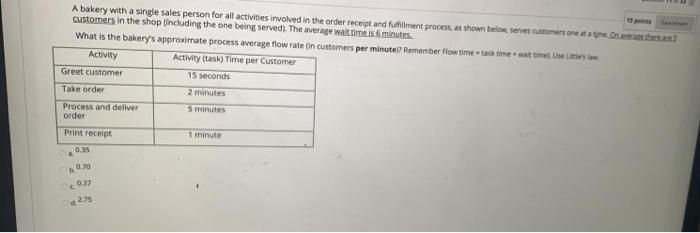
Anue getting a process into statistical control, a range chart was developed (3-sigmo limits) with LCL=0 and UCL 22.50 Similarly an average chart was developed (3 sigma limits) with 1.CLE 15 and UC.:24. Five monitoring samples subsequently taken read as follows: a) sample ranges 0.75, 242, 182,204, 255, and b) sample meana: 19.5.22.3. 16.55, 20,1, 23, respectively What can you tell management from this analysis? The proces variability has very likely shifted, but the proceun is in control and actually, it is a good thing practically speaking The process is very likely mill in statistical control since the sampling suppests that the proces average has not chanped, although the proces variability may have shiftud The process is very likely not in statistical control, since the sampling suggests that both pouces variability and the process wverage may have abited. The process is very likely not in statistical control in the sampling suspens that the proces variability has gone out of control although the sample means are still within theit zutro limits A bakery with a single sales person for all activities involved in the order receipt and fulfillment process, as shown below, serves customers one terre customers in the shop including the one being served). The average wat time is 6 minutes What is the bakery's approximate process average flow rate in customers per minute? Remember flow time take time time Use Activity Activity task) Time per Customer Greet customer 15 seconds Take order 2 minutes Process and deliver 5 minutes order Print receipt 1 minute 0.35 0.70 c03 2.75
Step by Step Solution
There are 3 Steps involved in it
1 Expert Approved Answer
Step: 1 Unlock

Question Has Been Solved by an Expert!
Get step-by-step solutions from verified subject matter experts
Step: 2 Unlock
Step: 3 Unlock