

Question: Need answer EJERCICIO 1 MC S ATC D=MR=P AVC N 0.50 500 3000 5,000 6,000 Q (UNIDADES) 1. The graph above represents the market structure
Need answer
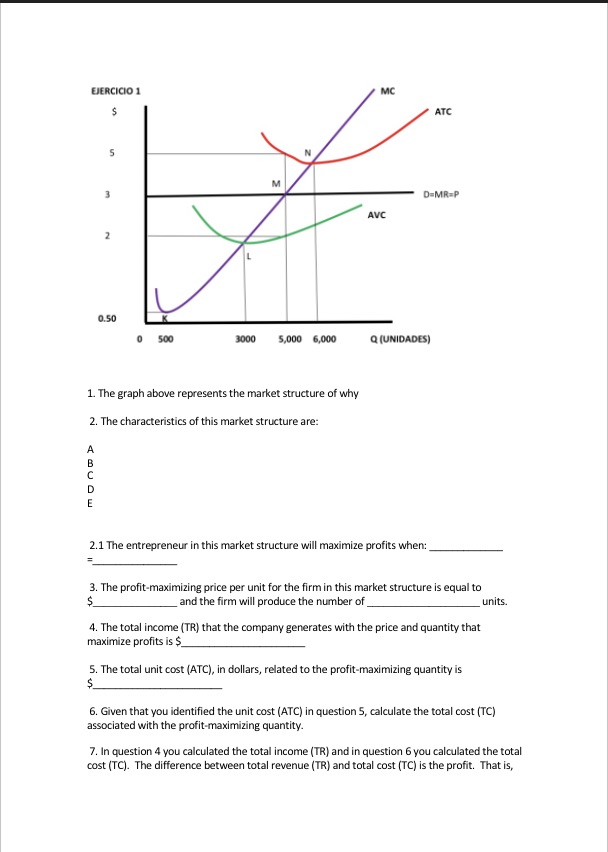
EJERCICIO 1 MC S ATC D=MR=P AVC N 0.50 500 3000 5,000 6,000 Q (UNIDADES) 1. The graph above represents the market structure of why 2. The characteristics of this market structure are: mono 2.1 The entrepreneur in this market structure will maximize profits when: 3. The profit-maximizing price per unit for the firm in this market structure is equal to and the firm will produce the number of units. 4. The total income (TR) that the company generates with the price and quantity that maximize profits is $_ 5. The total unit cost (ATC), in dollars, related to the profit-maximizing quantity is 6. Given that you identified the unit cost (ATC) in question 5, calculate the total cost (TC) associated with the profit-maximizing quantity. 7. In question 4 you calculated the total income (TR) and in question 6 you calculated the total cost (TC). The difference between total revenue (TR) and total cost (TC) is the profit. That is
Step by Step Solution
There are 3 Steps involved in it

Get step-by-step solutions from verified subject matter experts