

Question: Need assistance solving and doing graph hand drawn graphs are not easy to understand and plot the graphs have to be drawn with computer X
Need assistance solving and doing graph hand drawn graphs are not easy to understand and plot the graphs have to be drawn with computer
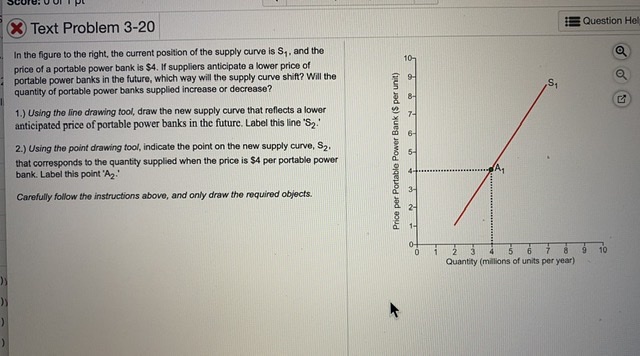
X Text Problem 3-20 Question Hol In the figure to the right, the current position of the supply curve is S, , and the price of a portable power bank is $4. If suppliers anticipate a lower price of portable power banks in the future, which way will the supply curve shift? Will the quantity of portable power banks supplied increase or decrease? 1.) Using the line drawing tool, draw the new supply curve that reflects a lower anticipated price of portable power banks in the future. Label this line 'S2.' 2.) Using the point drawing fool, indicate the point on the new supply curve, $2. that corresponds to the quantity supplied when the price is $4 per portable power bank. Label this point 'A2.' Carefully follow the instructions above, and only draw the required objects. Price per Portable Power Bank ($ per unit) TOROPP 3- O- 3 5 10 Quantity (millions of units per year)
Step by Step Solution
There are 3 Steps involved in it

Get step-by-step solutions from verified subject matter experts