

Question: Need assistance solving. Text Problem 3-17 Question Help In the figure to the right, the current position of the demand curve for a good is
Need assistance solving.
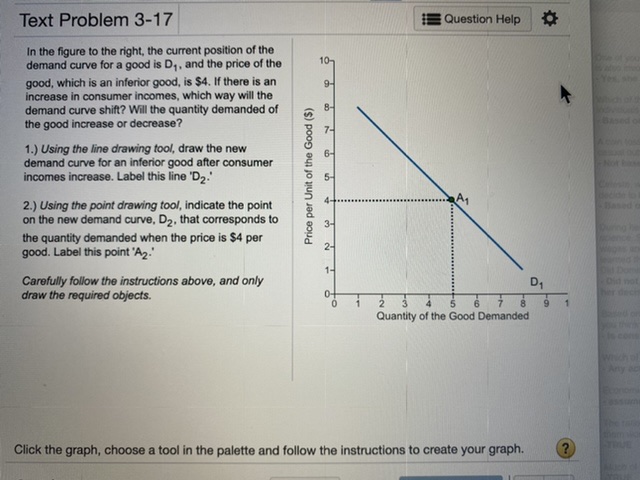
Text Problem 3-17 Question Help In the figure to the right, the current position of the demand curve for a good is D,, and the price of the 197 good, which is an inferior good, is $4. If there is an 9- increase in consumer incomes, which way will the demand curve shift? Will the quantity demanded of B- the good increase or decrease? 7- 1.) Using the line drawing tool, draw the new demand curve for an inferior good after consumer 6- incomes increase. Label this line 'D2." 2.) Using the point drawing tool, indicate the point on the new demand curve, D2. that corresponds to Price per Unit of the Good ($) 3- the quantity demanded when the price is $4 per good. Label this point "A2." 2- Carefully follow the instructions above, and only draw the required objects. D1 2 3 4 5 6 7 9 Quantity of the Good Demanded Click the graph, choose a tool in the palette and follow the instructions to create your graph
Step by Step Solution
There are 3 Steps involved in it

Get step-by-step solutions from verified subject matter experts