

Question: need charts c and d please 4 5 6 9 12 18 19 Vaughan Company had a fantastic sales 3rd Quarterl Management had wanted to
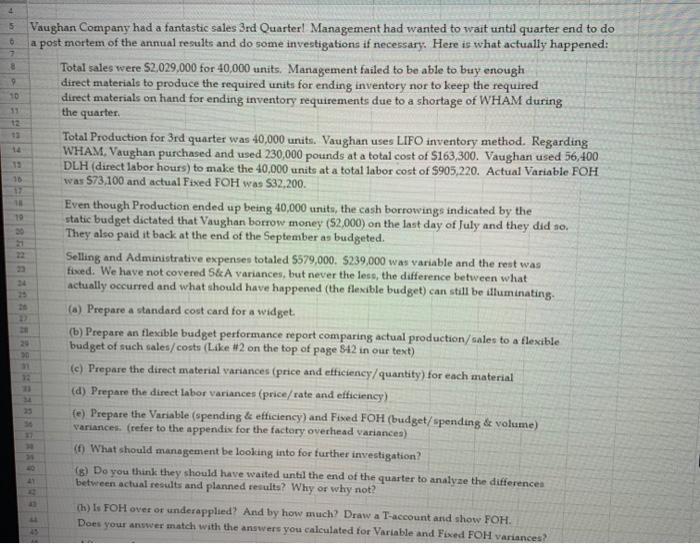
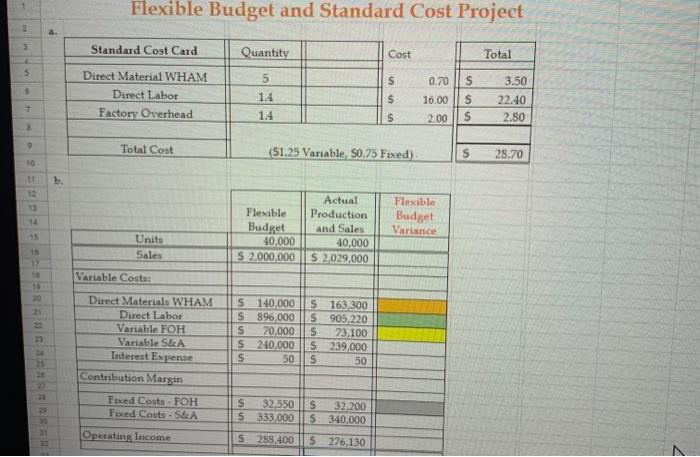
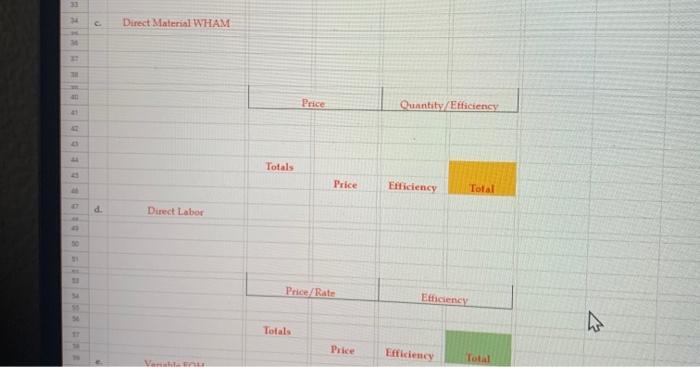
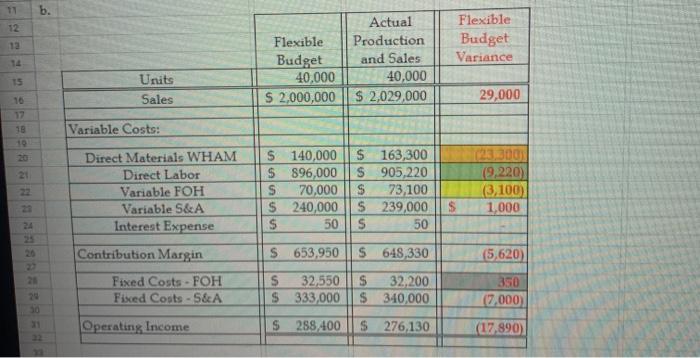
4 5 6 9 12 18 19 Vaughan Company had a fantastic sales 3rd Quarterl Management had wanted to wait until quarter end to do a post mortem of the annual results and do some investigations if necessary. Here is what actually happened: Total sales were 52,029,000 for 40,000 units. Management failed to be able to buy enough direct materials to produce the required units for ending inventory nor to keep the required direct materials on hand for ending inventory requirements due to a shortage of WHAM during the quarter. Total Production for 3rd quarter was 40,000 units. Vaughan uses LIFO inventory method. Regarding WHAM Vaughan purchased and used 230,000 pounds at a total cost of S163,300. Vaughan used 56,400 DLH (direct labor hours) to make the 40,000 units at a total labor cost of $905,220. Actual Variable FOH was $73,100 and actual Fixed FOH was S32,200. Even though Production ended up being 40,000 units, the cash borrowings indicated by the static budget dictated that Vaughan borrow money (52,000) on the last day of July and they did to. They also paid it back at the end of the September as budgeted. Selling and Administrative expenses totaled $579,000. $239,000 was variable and the rest was fixed. We have not covered S&A variances, but never the less, the difference between what actually occurred and what should have happened (the flexible budget) can still be dluminating () Prepare a standard cost card for a widget (b) Prepare an flexible budget performance report comparing actual production/sales to a flexible budget of such sales/costs (Like #2 on the top of page 842 in our text) (c) Prepare the direct material variances (price and efficiency/quantity) for each material (d) Prepare the direct labor variances (price/rate and efficiency) (e) Prepare the Variable (spending & efficiency) and Fixed FOH (budget/spending & vokime) variancel (refer to the appendix for the factory overhead variances) ( What should management be looking into for further investigation? (8) Do you think they should have waited until the end of the quarter to analyze the differences between actual results and planned results? Why or why not? (h) Is FOH over or underapplied? And by how much? Draw a T-account and show FOH. Does your answer match with the answers you calculated for Variable and Fixed FOH variances? 34 20 30 12 Flexible Budget and Standard Cost Project 2 Standard Cost Card Quantity Cost Total 5 5 s us 6 Direct Material WHAM Direct Labor Factory Overhead $ 1.4 1.4 0.70 16.00 2.00 S S 3.50 22.40 2.80 $ 3 Total Cost (S1.25 Variable, 50.75 Fixed) $ 28.70 10 11 b. Actual Production and Sales 40,000 $ 2,029,000 Flexible Budget 40,000 $ 2,000,000 Flexible Budget Variance Units Sales Variable Costs Direct Materials WHAM Direct Labor Variable FOH Variable SEA Interest Expense Contribution Margin Fixed Costs - FOH Fixed Costs - SEA S 140,000 S 896,000 S 70,000 S 240,000 50 S 163,300 $ 905,220 s 73,100 S 239.000 $ 50 22 22 5 32,550 5 333 000 32,200 $ 340,000 Illus Operating Income s 285,400 $ 276,130 7 Direct Material WHAM Price Quantity/Efficiency GU10 Totals Price Efficiency Total d. Direct Labor PriceRate Ethiciency 51 W Totals Price Efficiency Total b. 12 Actual Production and Sales 40,000 $ 2,029,000 Flexible Budget Variance Flexible Budget 40,000 $ 2,000,000 Units Sales 29,000 17 18 Variable Costs: e NASAREHE Direct Materials WHAM Direct Labor Variable FOH Variable S&A Interest Expense $ 140,000 $ 896,000 S 70,000 $ 240,000 $ 50 $ 163,300 $ 905,220 S 73100 $ 239,000 $ 50 (9,220) (3,100) 1,000 $ S 653,950 $ 648,330 (5.620) Contribution Margin Fixed Costs - FOH Fised Costs - 5&A 350 $ 32,550 $ 333,000 S 32,200 $ 340,000 (7,000) Operating Income S 288.400 $ 276,130 (17,890)
Step by Step Solution
There are 3 Steps involved in it

Get step-by-step solutions from verified subject matter experts