

Question: need correct code to produce output Q5: does this dataset indicate a higher prevalence of diabetes among pregnant individuals compared to non-pregnant individuals? (total 6
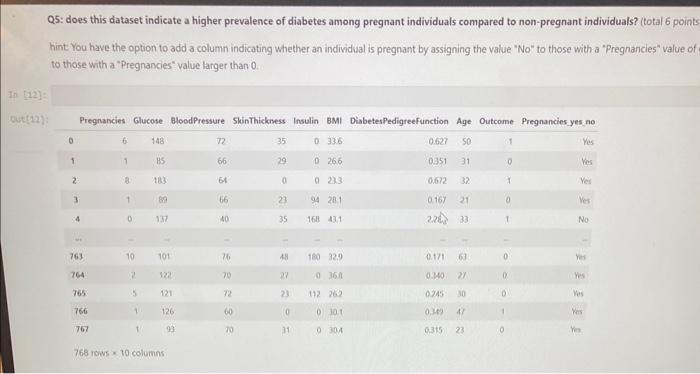
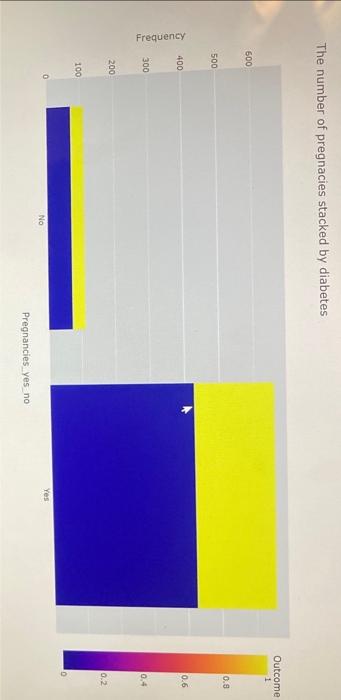
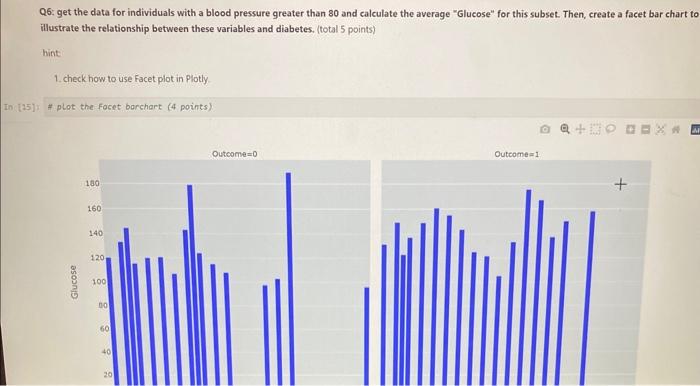
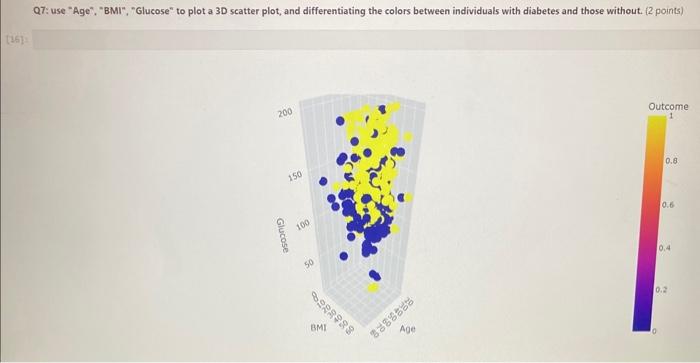
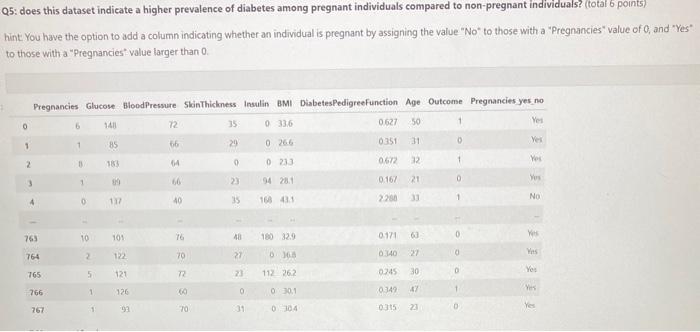
Q5: does this dataset indicate a higher prevalence of diabetes among pregnant individuals compared to non-pregnant individuals? (total 6 points hint You have the option to add a column indicating whether an individual is pregnant by assigning the value "No" to those with a "Pregnancies" value of to those with a "Pregnancies" value larger than 0 . The number of pregnacies stacked by diabetes Q6: get the data for individuals with a blood pressure greater than 80 and calculate the average "Glucose" for this subset. Then, create a facet bar chart the illustrate the relationship between these variables and diabetes. (total 5 points) hint 1. check how to use facet plot in Plotly. Q7: use "Age", "BMI", "Glucose" to plot a 3D scatter plot, and differentiating the colors between individuals with diabetes and those without. (2 points) Q5: does this dataset indicate a higher prevalence of diabetes among pregnant individuals compared to non-pregnant individuals? (total 6 points) hint You have the option to add a column indicating whether an individual is pregnant by assigning the value "No" to those with a "Pregnancies" value of 0 , and "Yes" to those with a "Pregnancies" value larger than 0
Step by Step Solution
There are 3 Steps involved in it

Get step-by-step solutions from verified subject matter experts