

Question: Need explanation? QUESTION 8 Data were collected from a random sample of elementary schools in a certain state, The following is the data set on
Need explanation?
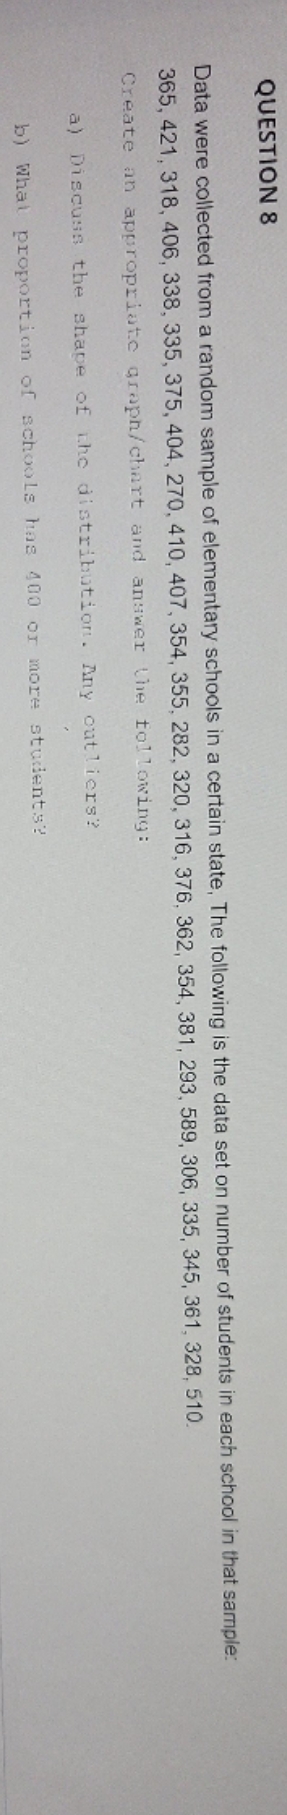
QUESTION 8 Data were collected from a random sample of elementary schools in a certain state, The following is the data set on number of students in each school in that sample: 365, 421, 318, 406, 338, 335, 375, 404, 270, 410, 407, 354, 355, 282, 320, 316, 376, 362, 354, 381, 293, 589, 306, 335, 345, 361, 328, 510. Create an appropriate graph/ chart and answer the following: a) Discuss the shape of the distribution. Any outliers? b) What proportion of schools has 400 or more students
Step by Step Solution
There are 3 Steps involved in it
1 Expert Approved Answer
Step: 1 Unlock

Question Has Been Solved by an Expert!
Get step-by-step solutions from verified subject matter experts
Step: 2 Unlock
Step: 3 Unlock