

Question: Need formula for ratios. Dec. 31, 2017 Dec 31, 2016 $ 687,521 $ 759,984 5,519 329,986 2,105,662 538,202 47,518 175,853 3,884,742 4,859,424 967,781 19,816 55,947
Need formula for ratios.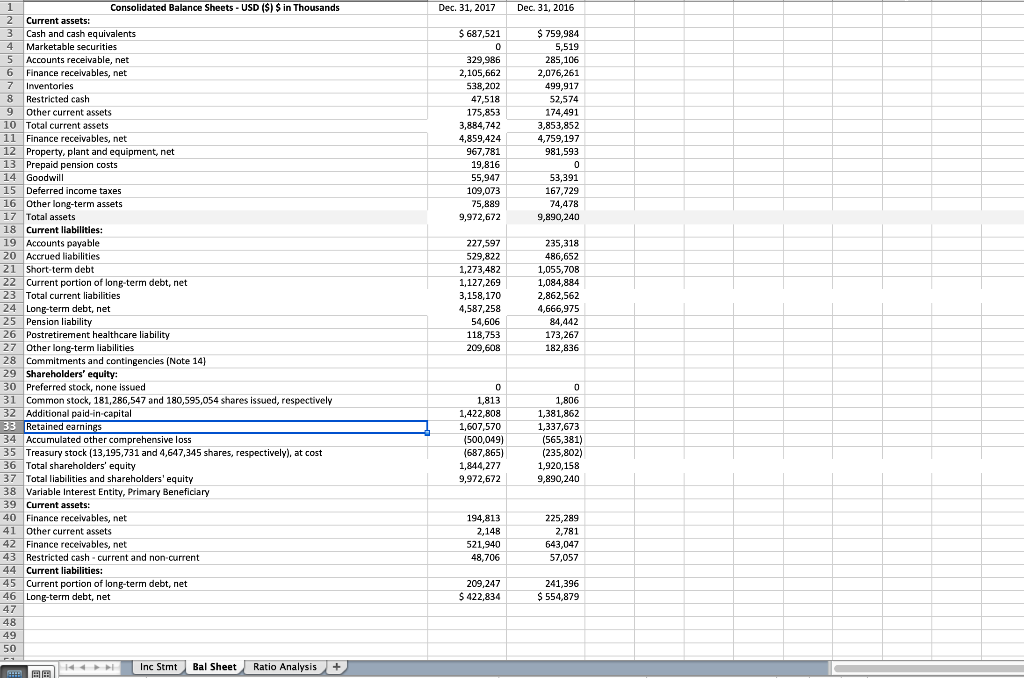
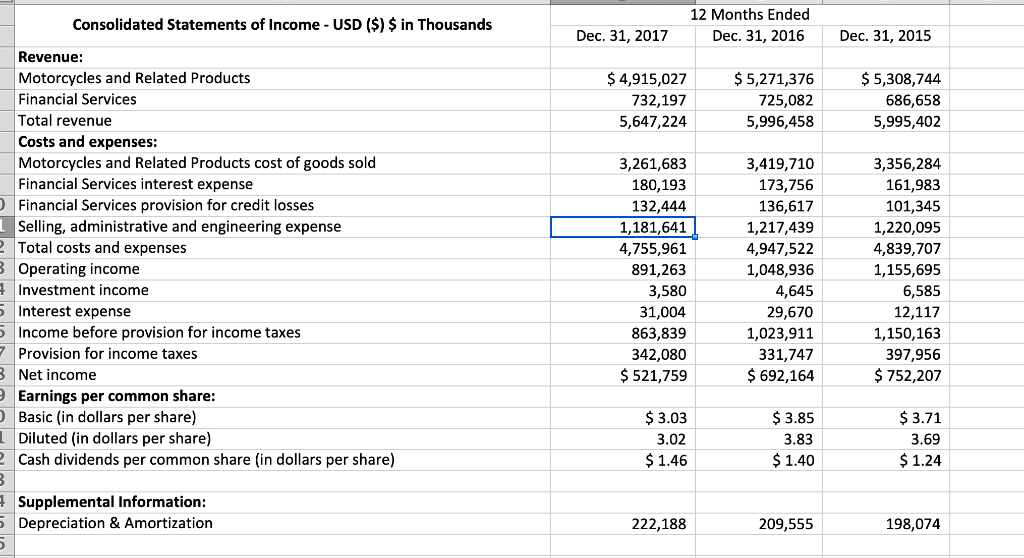
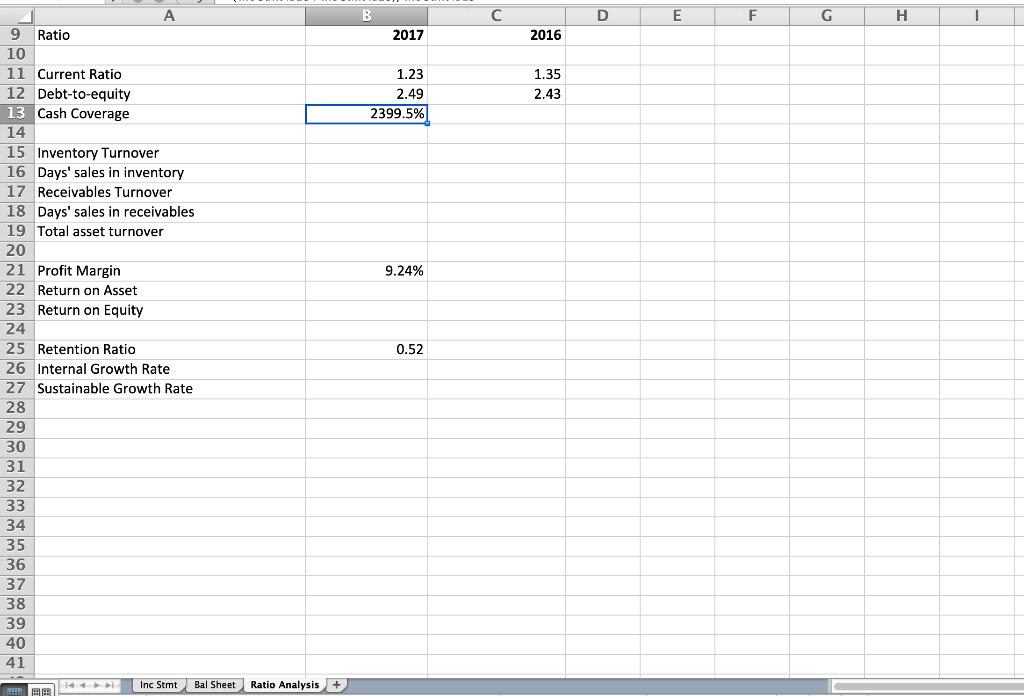
Dec. 31, 2017 Dec 31, 2016 $ 687,521 $ 759,984 5,519 329,986 2,105,662 538,202 47,518 175,853 3,884,742 4,859,424 967,781 19,816 55,947 109,073 75,889 9,972,672 285,106 2,076,261 499,917 52,574 174,491 3,853,852 4,759,197 981,593 53,391 167,729 74,478 9,890,240 Consolidated Balance Sheets - USD ($) $ in Thousands 2 Current assets: 3 Cash and cash equivalents 4 Marketable securities 5 Accounts receivable, net 6 Finance receivables, net 7 Inventories 8 Restricted cash 9 other current assets 10 Total current assets 11 Finance receivables, net 12 Property, plant and equipment, net 13 Prepaid pension costs 14 Goodwill 15 Deferred income taxes 16 Other long-term assets 17 Total assets 18 Current liabilities: 19 Accounts payable 20 Accrued liabilities 21 Short-term debt 22 Current portion of long-term debt, net 23 Total current liabilities 24 Long-term debt, net 25 Pension liability 26 Postretirement healthcare liability 27 Other long-term liabilities 28 Commitments and contingencles (Note 14) 29 Shareholders' equity: 30 Preferred stock, none issued 31 Common stock, 181,286,547 and 180,595,054 shares issued, respectively 32 Additional paid-in-capital 33 Retained earnings 34 Accumulated other comprehensive loss 35 Treasury stock (13,195,731 and 4,647,345 shares, respectively), at cost 36 Total shareholders' equity 37 Total liabilities and shareholders' equity 38 Variable Interest Entity, Primary Beneficiary 39 Current assets: 40 Finance receivables, net 41 Other current assets 42 Finance receivables, net 43 Restricted cash-current and non-current 44 Current liabilities: 45 Current portion of long-term debt, net 46 Long-term debt, net 47 227,597 529,822 1,273,482 1,127,269 3,158,170 4,587,258 54.606 118.753 209,608 235,318 486,652 1,055,708 1,084,884 2,862,562 4,666,975 84,442 173,267 182,836 1,813 1,422,808 1,607,570 (500,049) (687,865) 1,844,277 9,972,672 1,806 1,381,862 1,337,673 (565,381) (235,802) 1,920,158 9,890,240 194,813 2,148 521,940 48,706 225,289 2,781 643,047 57,057 209,247 $ 422,834 241,396 $ 554,879 48 49 50 A + Inc Stmt Bal Sheet Ratio Analysis + Consolidated Statements of Income - USD ($) $ in Thousands 12 Months Ended Dec. 31, 2016 Dec. 31, 2017 Dec. 31, 2015 $ 4,915,027 732,197 5,647,224 $ 5,271,376 725,082 5,996,458 $5,308,744 686,658 5,995,402 Revenue: Motorcycles and Related Products Financial Services Total revenue Costs and expenses: Motorcycles and Related Products cost of goods sold Financial Services interest expense Financial Services provision for credit losses I Selling, administrative and engineering expense 2 Total costs and expenses B Operating income 4 Investment income 5 Interest expense Income before provision for income taxes 7 Provision for income taxes 3 Net income Earnings per common share: ) Basic (in dollars per share) Diluted (in dollars per share) Cash dividends per common share (in dollars per share) 3,261,683 180,193 132,444 1,181,641 4,755,961 891,263 3,580 31,004 863,839 342,080 $ 521,759 3,419,710 173,756 136,617 1,217,439 4,947,522 1,048,936 4,645 29,670 1,023,911 331,747 $ 692,164 3,356,284 161,983 101,345 1,220,095 4,839,707 1,155,695 6,585 12,117 1,150,163 397,956 $ 752,207 $ 3.03 3.02 $ 1.46 $ 3.85 3.83 $ 1.40 $ 3.71 3.69 $ 1.24 Supplemental Information: Depreciation & Amortization 222,188 209,555 198,074 D E F G H 2017 2016 1.23 2.49 2399.5% 1.35 2.43 9 Ratio 10 11 Current Ratio 12 Debt-to-equity 13 Cash Coverage 14 15 Inventory Turnover 16 Days' sales in inventory 17 Receivables Turnover 18 Days' sales in receivables 19 Total asset turnover 20 21 Profit Margin 22 Return on Asset 23 Return on Equity 24 25 Retention Ratio 26 Internal Growth Rate 27 Sustainable Growth Rate 28 29 9.24% 0.52 30 31 32 33 34 35 36 37 38 39 40 41 Inc Stmt Bal Sheet Ratio Analysis +
Step by Step Solution
There are 3 Steps involved in it

Get step-by-step solutions from verified subject matter experts