

Question: Need handwritten picture with full working . Question 4 (Mark: 10 + 5) A bakery's quarterly sales of a product (in thousands) as well as
Need handwritten picture with full working .
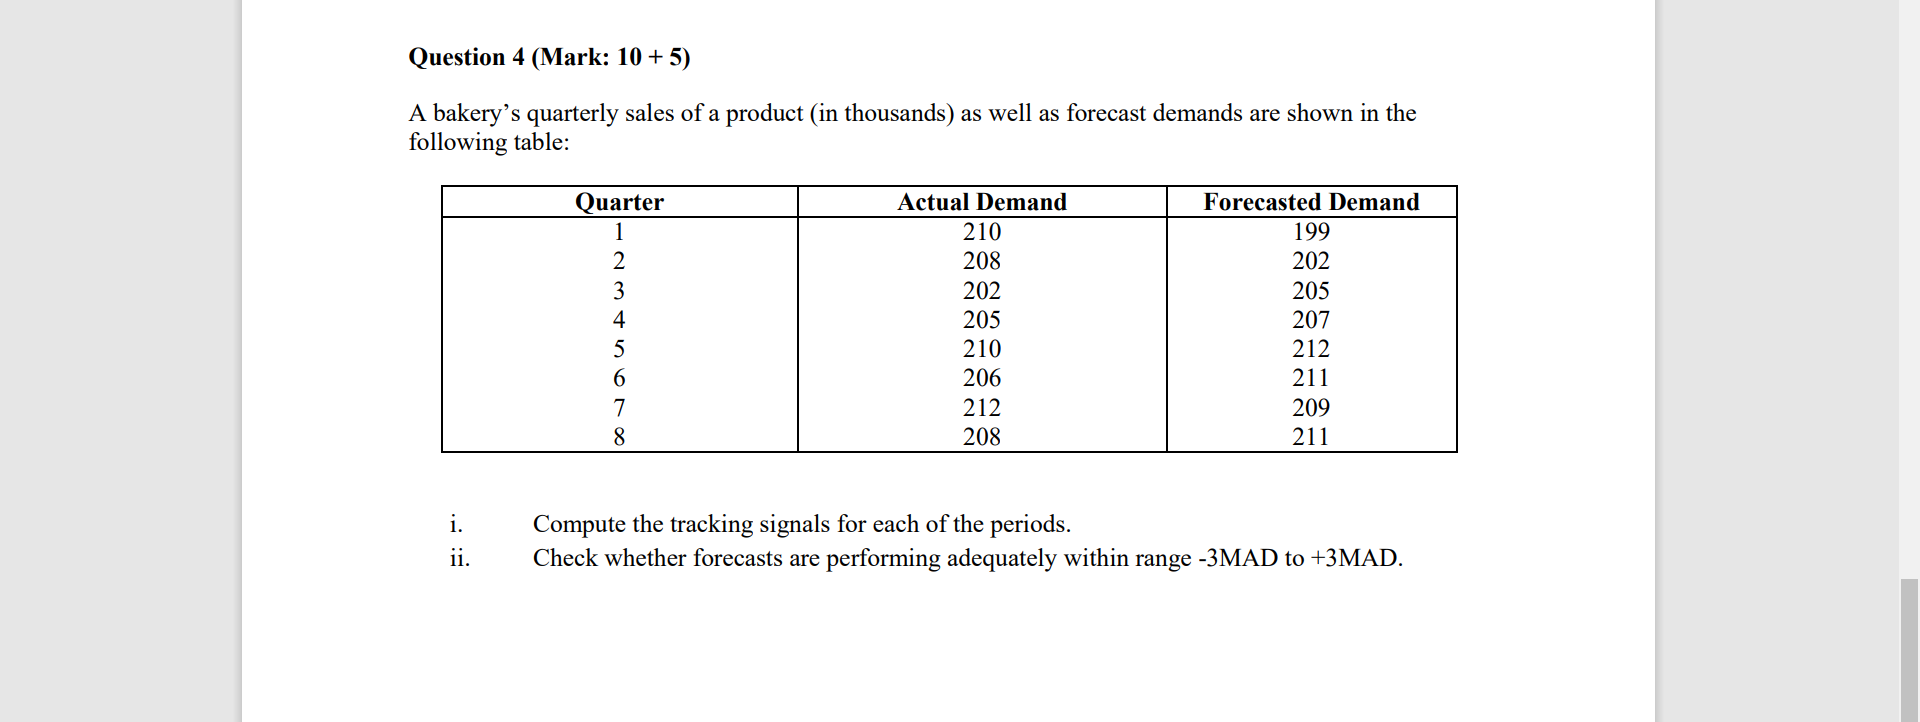
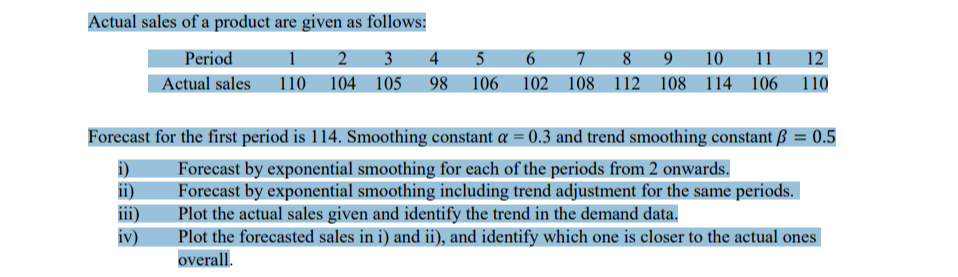
Question 4 (Mark: 10 + 5) A bakery's quarterly sales of a product (in thousands) as well as forecast demands are shown in the following table: Actual Demand 210 Quarter 1 2 3 4 5 6 7 8 208 202 205 210 206 212 208 Forecasted Demand 199 202 205 207 212 211 209 211 i. ii. Compute the tracking signals for each of the periods. Check whether forecasts are performing adequately within range -3MAD to +3MAD. Actual sales of a product are given as follows: Period 2 3 4 Actual sales 110 104 105 98 6 5 106 7 8 9 10 11 12 108 112 108 114 106 110 102 Forecast for the first period is 114. Smoothing constant a = 0.3 and trend smoothing constant = 0.5 1) Forecast by exponential smoothing for each of the periods from 2 onwards. Forecast by exponential smoothing including trend adjustment for the same periods. iii) Plot the actual sales given and identify the trend in the demand data. iv) Plot the forecasted sales in i) and ii), and identify which one is closer to the actual ones overallStep by Step Solution
There are 3 Steps involved in it
1 Expert Approved Answer
Step: 1 Unlock

Question Has Been Solved by an Expert!
Get step-by-step solutions from verified subject matter experts
Step: 2 Unlock
Step: 3 Unlock