

Question: Need help all three graphs answers options are : average cycle time , boards completed, and direct labor hours Richard Ellis, the director of cost
 Need help all three graphs answers options are : average cycle time , boards completed, and direct labor hours
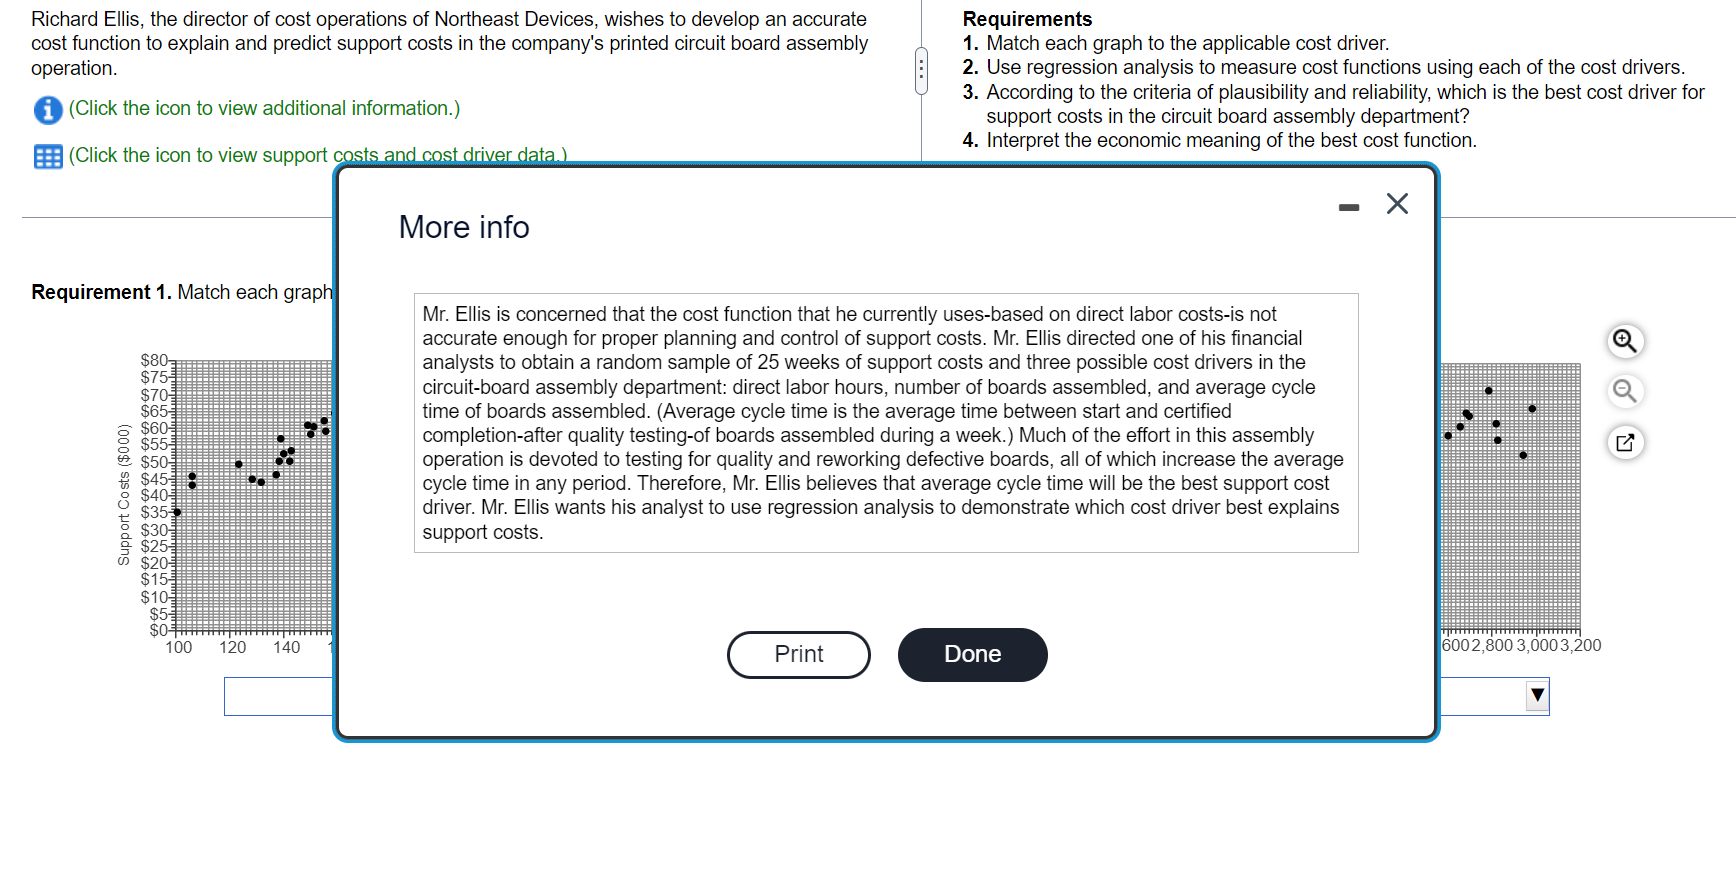
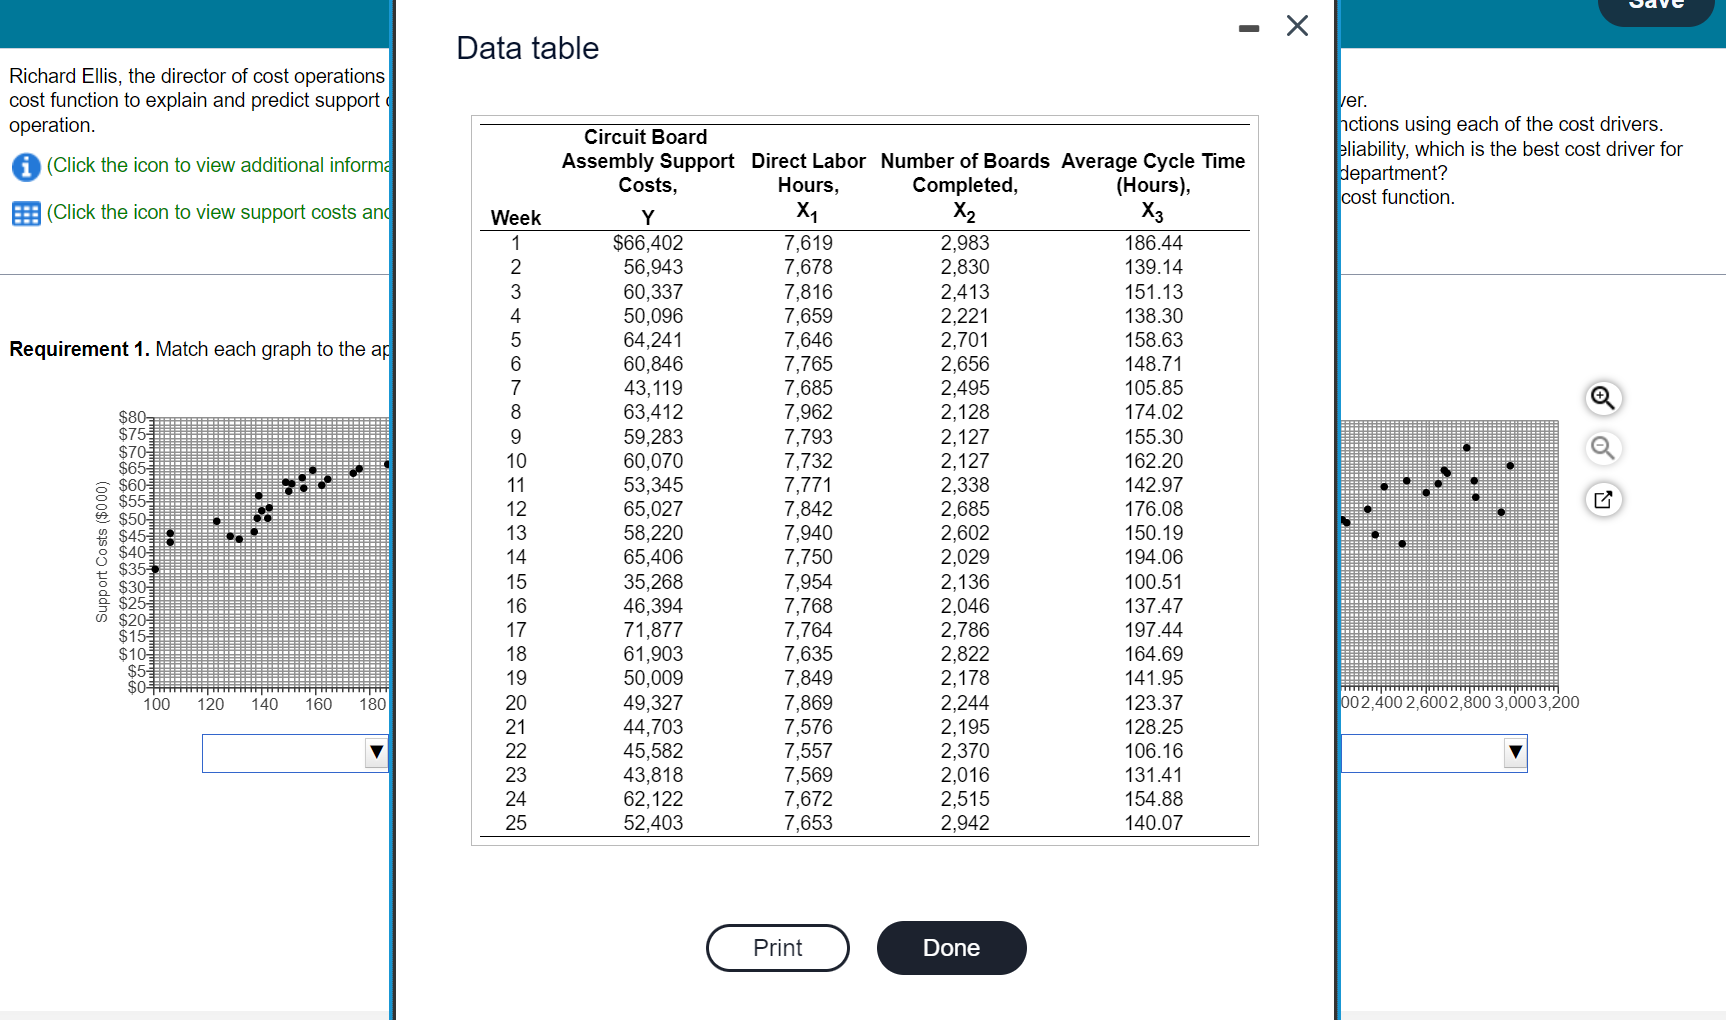
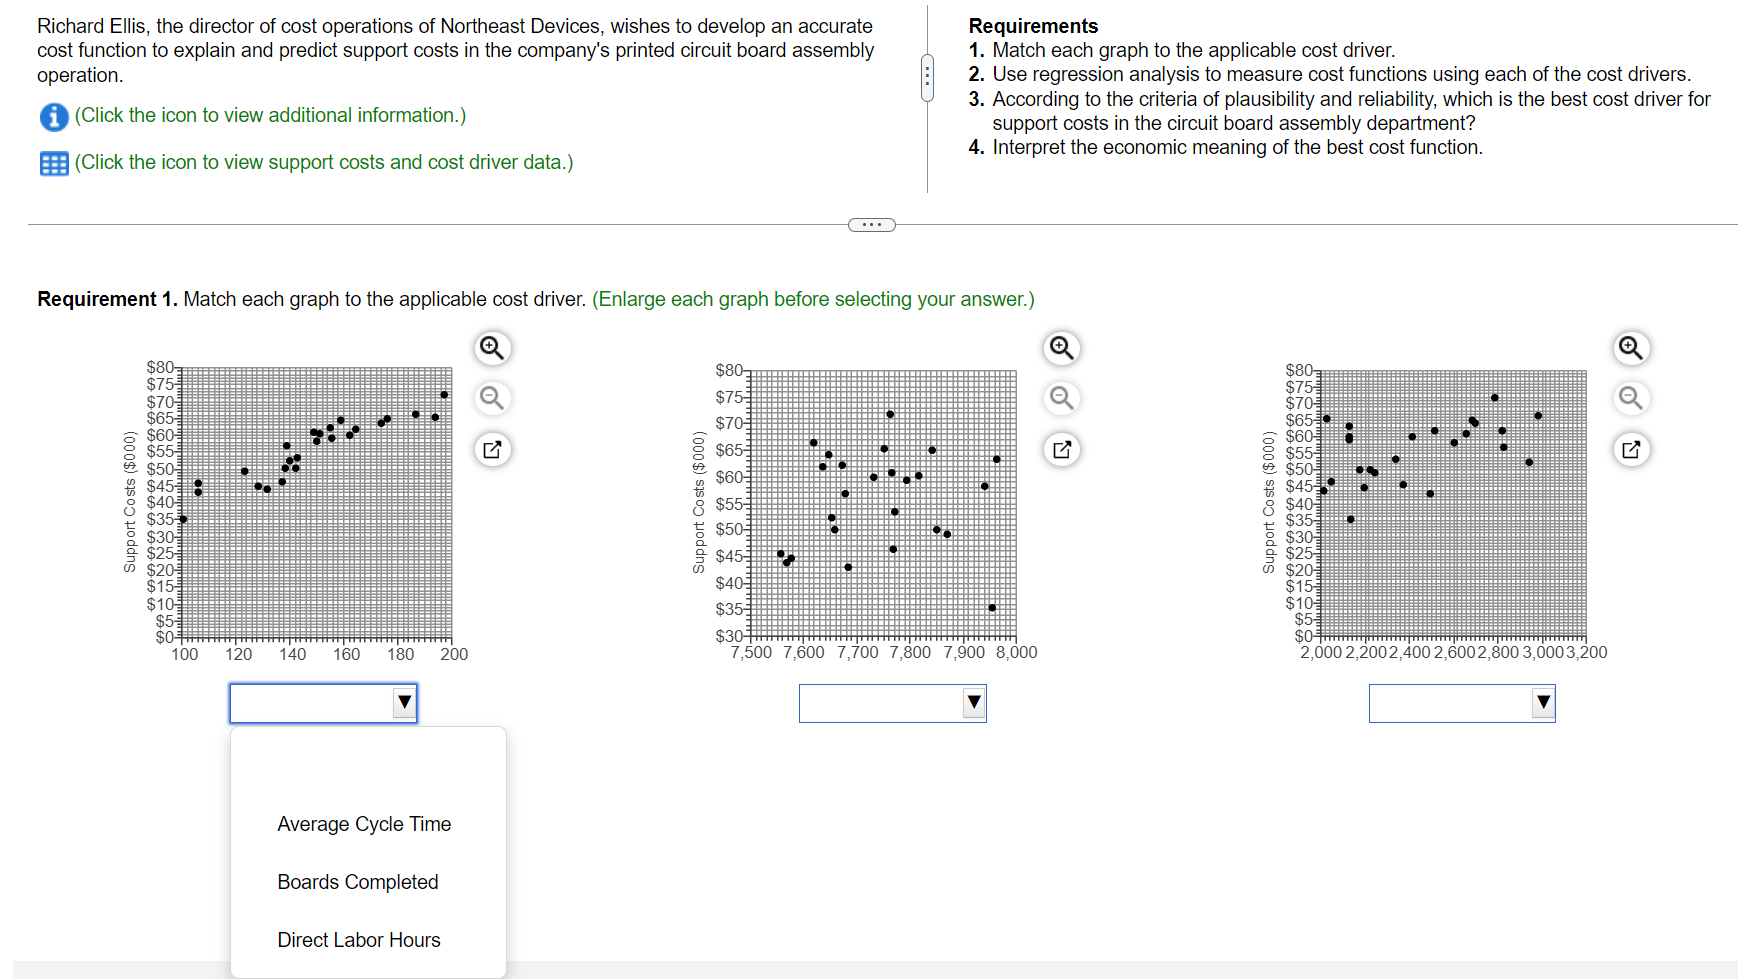
Richard Ellis, the director of cost operations of Northeast Devices, wishes to develop an accurate cost function to explain and predict support costs in the company's printed circuit board assembly operation Requirements 1. Match each graph to the applicable cost driver. 2. Use regression analysis to measure cost functions using each of the cost drivers. 3. According to the criteria of plausibility and reliability, which is the best cost driver for support costs in the circuit board assembly department? 4. Interpret the economic meaning of the best cost function. (Click the icon to view additional information.) E: (Click the icon to view support costs and cost driver data.) Requirement 1. Match each graph to the applicable cost driver. (Enlarge each graph before selecting your answer.) a Q $80 $75 $70 $65 $60 8 $55 $50 $45 $80 $75 $70 $65 $60 $55 $50 $4510 8 $400 $35 $30 $25 0 $20 $15 $10 $5 $0 100 Support Costs ($000) Support Costs ($000) $80- $75 $70 $65 $60 $55 $50 $45 $40 $35 $307 7,500 7,600 7,700 7,800 7,900 8,000 8 $40 $35 $30 $25 $20 $15 $10 $5 $0 2,000 2,2002,400 2,600 2,800 3,0003,200 120 140 160 180 200 Average Cycle Time Boards Completed Direct Labor Hours Richard Ellis, the director of cost operations of Northeast Devices, wishes to develop an accurate cost function to explain and predict support costs in the company's printed circuit board assembly operation. Requirements 1. Match each graph to the applicable cost driver. 2. Use regression analysis to measure cost functions using each of the cost drivers. 3. According to the criteria of plausibility and reliability, which is the best cost driver for support costs in the circuit board assembly department? 4. Interpret the economic meaning of the best cost function. (Click the icon to view additional information.) (Click the icon to view support costs and cost driver data) More info Requirement 1. Match each graph Mr. Ellis is concerned that the cost function that he currently uses-based on direct labor costs-is not accurate enough for proper planning and control of support costs. Mr. Ellis directed one of his financial analysts to obtain a random sample of 25 weeks of support costs and three possible cost drivers in the circuit-board assembly department: direct labor hours, number of boards assembled, and average cycle time of boards assembled. (Average cycle time is the average time between start and certified completion-after quality testing-of boards assembled during a week.) Much of the effort in this assembly operation is devoted to testing for quality and reworking defective boards, all of which increase the average cycle time in any period. Therefore, Mr. Ellis believes that average cycle time will be the best support cost driver. Mr. Ellis wants his analyst to use regression analysis to demonstrate which cost driver best explains support costs. O $80 $751 $70 $65 $60 $55 $50 $451 $40 $35 $30 $25 $20 $15 $10 $5 $0# 100 Support Costs ($000) 120 140 Print Done 6002,800 3,0003,200 Data table Richard Ellis, the director of cost operations cost function to explain and predict support operation. Ver. nctions using each of the cost drivers. pliability, which is the best cost driver for department? cost function. (Click the icon to view additional informa (Click the icon to view support costs and 07 AWN Requirement 1. Match each graph to the ap $80 $75 $70 $65 $60 $55 $50 $4519 $40 $35 $30 $25 o $20 $15 $10 $5 $07 100 Support Costs ($000) Circuit Board Assembly Support Direct Labor Number of Boards Average Cycle Time Costs, Hours, Completed, (Hours), Y X1 X2 X $66,402 7,619 2,983 186.44 56,943 7,678 2.830 139.14 60,337 7,816 2.413 151.13 50,096 7,659 2,221 138.30 64,241 7,646 2,701 158.63 60,846 7,765 2,656 148.71 43,119 7,685 2,495 105.85 63,412 7,962 2,128 174.02 59,283 7,793 2,127 155.30 60,070 7,732 2,127 162.20 53,345 7,771 2,338 142.97 65,027 7,842 2,685 176.08 58,220 7,940 2,602 150.19 65,406 7,750 2,029 194.06 35,268 7,954 2,136 100.51 46,394 7,768 2,046 137.47 71,877 7,764 2,786 197.44 61,903 7,635 2,822 164.69 50,009 7,849 2,178 141.95 49,327 7,869 2,244 123.37 44,703 7,576 2,195 128.25 45,582 7,557 2,370 106.16 43,818 7,569 2,016 131.41 62,122 7,672 2,515 154.88 52,403 7,653 2,942 140.07 Week 1 2 3 4 5 6 7 8 9 10 11 12 13 14 15 16 17 18 19 20 21 22 23 24 25 120 140 160 180 002,400 2,600 2,800 3,000 3,200 Print Done
Step by Step Solution
There are 3 Steps involved in it

Get step-by-step solutions from verified subject matter experts