

Question: Need help and provide full process!!! The textbook refer grade 12 data management The textbook refer grade 12 data management similar to these two: 5.
Need help and provide full process!!!
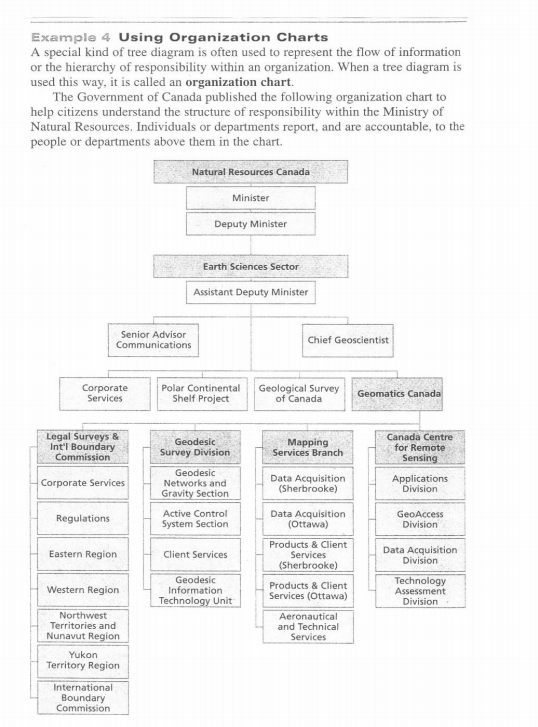
The textbook refer grade 12 data management
The textbook refer grade 12 data management
similar to these two: 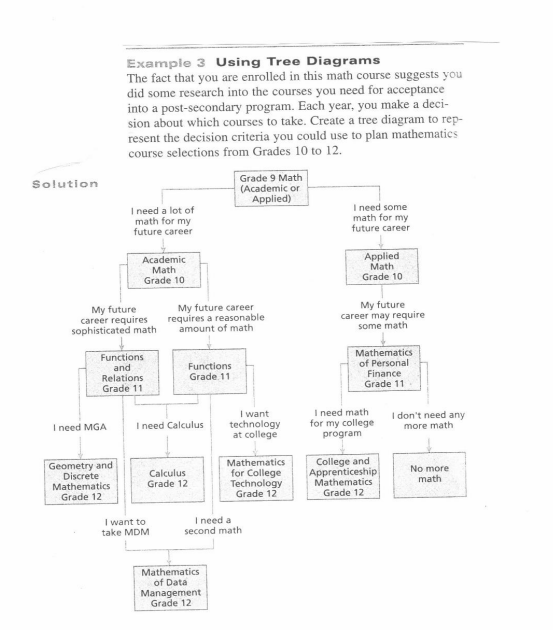
Step by Step Solution
There are 3 Steps involved in it
1 Expert Approved Answer
Step: 1 Unlock

Question Has Been Solved by an Expert!
Get step-by-step solutions from verified subject matter experts
Step: 2 Unlock
Step: 3 Unlock