

Question: need help bad K The graph of the function has one relative extreme point. Plot this point and check the concavity there. Using only this
need help bad

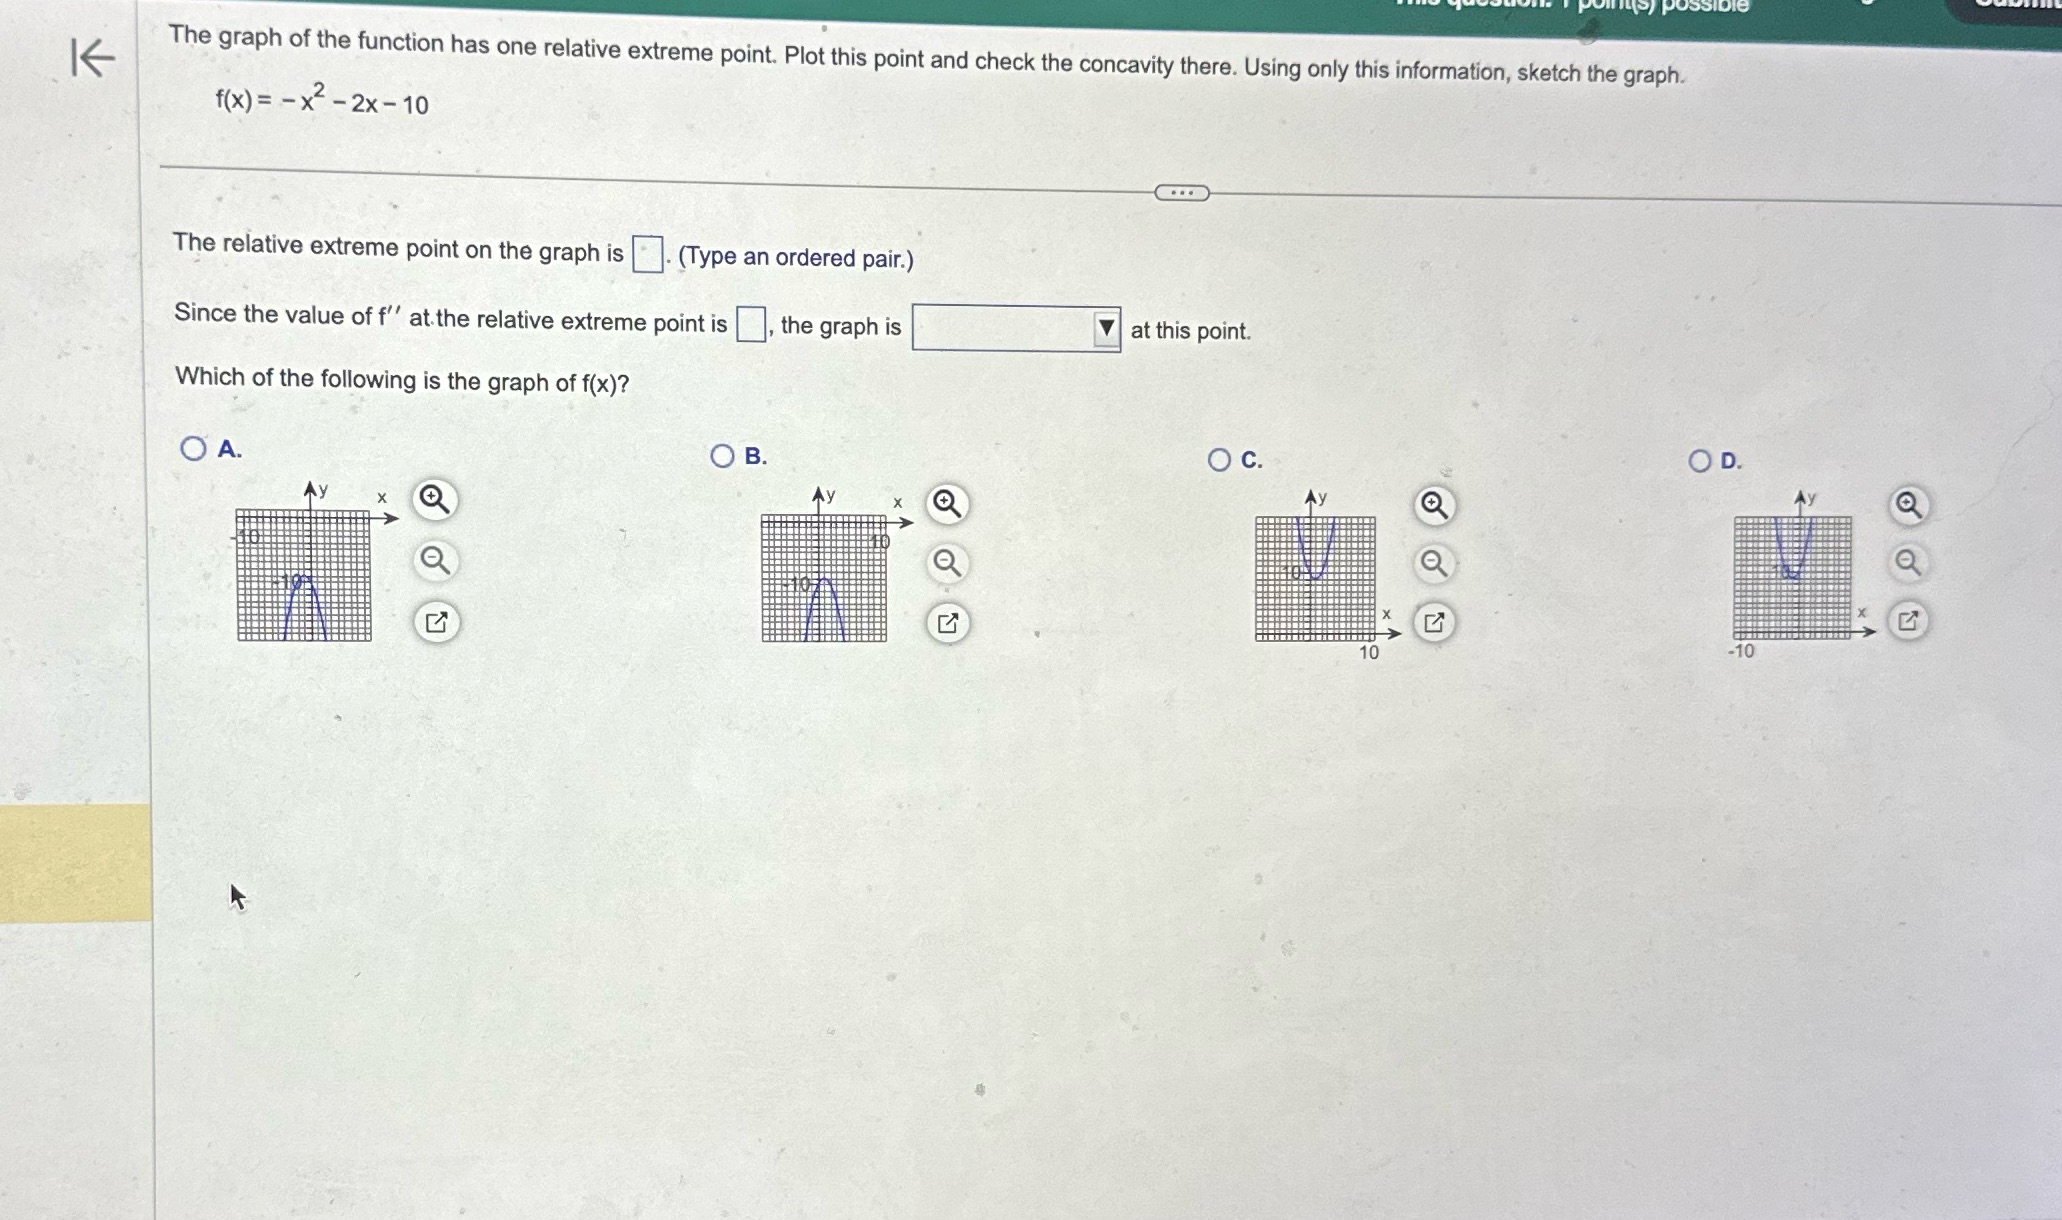
K The graph of the function has one relative extreme point. Plot this point and check the concavity there. Using only this information, sketch the graph. f(x) = -x2-2x - 10 The relative extreme point on the graph is . (Type an ordered pair.) Since the value of f" at the relative extreme point is , the graph is V at this point. Which of the following is the graph of f(x)? O A. O B O C. OD. Ay Ay Ay Ay X THE AIN THI A -10 10
Step by Step Solution
There are 3 Steps involved in it
1 Expert Approved Answer
Step: 1 Unlock

Question Has Been Solved by an Expert!
Get step-by-step solutions from verified subject matter experts
Step: 2 Unlock
Step: 3 Unlock