

Question: Need help checking if the yellow box answers are correct. please provide formulas, cheers below is the data 177 Using Regression to Forecast Sales 178
 Need help checking if the yellow box answers are correct. please provide formulas, cheers
below is the data
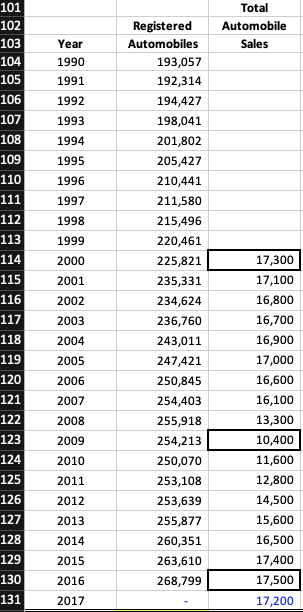
177 Using Regression to Forecast Sales 178 A common approach to forecasting is statistical. 179 As we did not have a value for 2017 'Total Automobile Sales' at the time of this analysis (see discussion of data integrity above), we will use history through 2016. 180 Let's see how sensitive your result is to the selection of the historical period. 181 In the yellow cell immediately below use the TREND function to forecast how many automobiles will be sold in 2030 based on the data from 2009-2016. 182 (76,207) 183 In statistical analyses, the results can be extremely sensitive to the historical period selected. 184 This is particularly true when forecasting sales of cyclical industries'. 185 In the yellow cell immediately below use the TREND function to forecast how many automobiles will be sold 2030 based on the data from 2000-2016. 186 25,865 187 This is 60% less than your original estimate. 188 Automobile assembly is a highly cyclical because of extremely high fixed costs because of significant Property, Plant & Equipment (PP&E) and strong union limits of layoffs and temporary workers. 189 It is generally dangerous to extrapolate a relationship beyond the domain of your independent variables (above or below the extreme X-values). 190 However, using a time series to forecast forward by definition requires extrapolating forward. Total Automobile Sales 101 102 103 104 105 106 107 108 109 Year 1990 1991 1992 1993 1994 1995 1996 1997 110 111 1998 1999 2000 2001 2002 112 113 114 115 116 117 118 119 120 121 122 Registered Automobiles 193,057 192,314 194,427 198,041 201,802 205,427 210,441 211,580 215,496 220,461 225,821 235,331 234,624 236,760 243,011 247,421 250,845 254,403 255,918 254,213 250,070 253,108 253,639 255,877 260,351 263,610 268,799 2003 2004 2005 2006 2007 2008 123 17,300 17,100 16,800 16,700 16,900 17,000 16,600 16,100 13,300 10,400 11,600 12,800 14,500 15,600 16,500 17,400 17,500 17,200 2009 2010 124 125 126 127 128 129 130 131 2011 2012 2013 2014 2015 2016 2017
Step by Step Solution
There are 3 Steps involved in it

Get step-by-step solutions from verified subject matter experts