

Question: Need help completing this chart. Specifically, please provide the formula that you used to calculate each box with an X and the numbers that you
Need help completing this chart. Specifically, please provide the formula that you used to calculate each box with an "X" and the numbers that you used in each formula so I can follow them. Please label which formulas you used to calculate each box with an "X" in it. Since many of these have to be backed into. Please provide step by step so I know which ones you calculated first to back into the next one. Also, it must be possible to use a re-arrangement of the profit formula to solve some of these too, but I cannot figure out how to rearrange that formula. Thank you for your help.
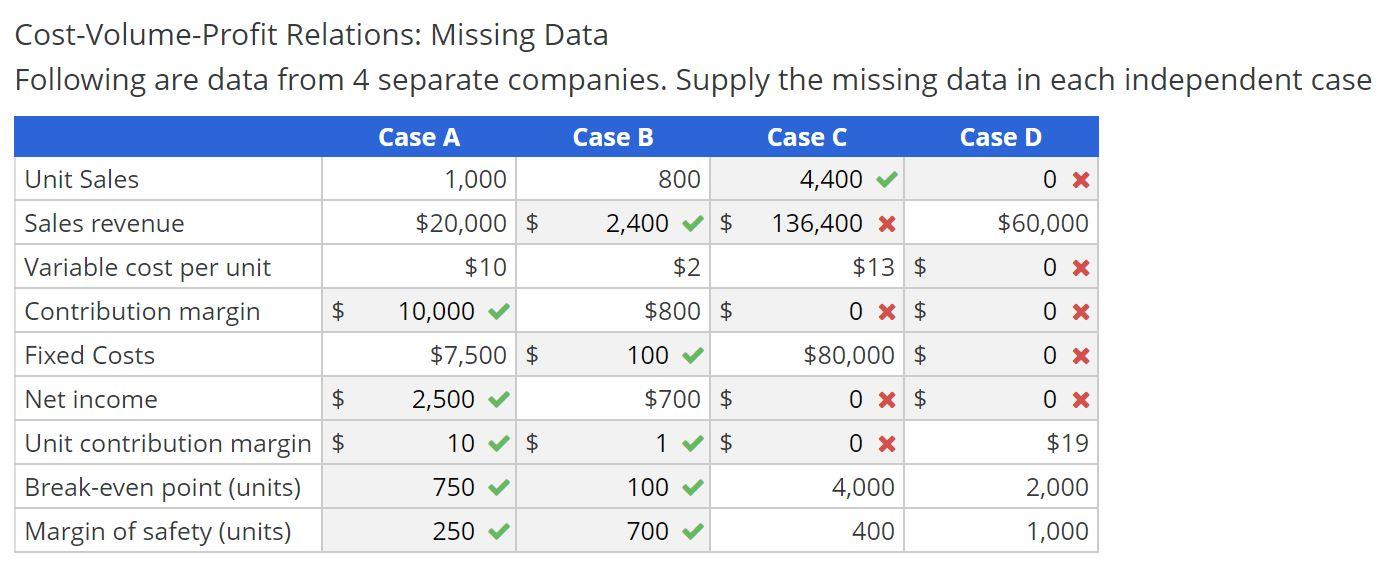
Cost-Volume-Profit Relations: Missing Data Following are data from 4 separate companies. Supply the missing data in each independent case Case A Case B Case C Case D Unit Sales 1,000 800 OX 4,400 136,400 x Sales revenue $20,000 $ 2,400 $ $60,000 $10 $2 $13 $ 0 x Variable cost per unit Contribution margin $ $800 $ 0 x $ 0 x Fixed Costs 10,000 $7,500 $ 2,500 100 $80,000 $ OX Net income $ $700 $ 0 x $ 0 x 10 $ 1 $ 0 x $19 Unit contribution margin $ Break-even point (units) Margin of safety (units) 750 100 4,000 2,000 1,000 250 700 400
Step by Step Solution
There are 3 Steps involved in it

Get step-by-step solutions from verified subject matter experts