

Question: Need help with problem b and thank you Homework: 6-2 MyStatLab: Module Six Problem Set Save Score: 1 of 5 pts 9 of 14 (14
Need help with problem b and thank you
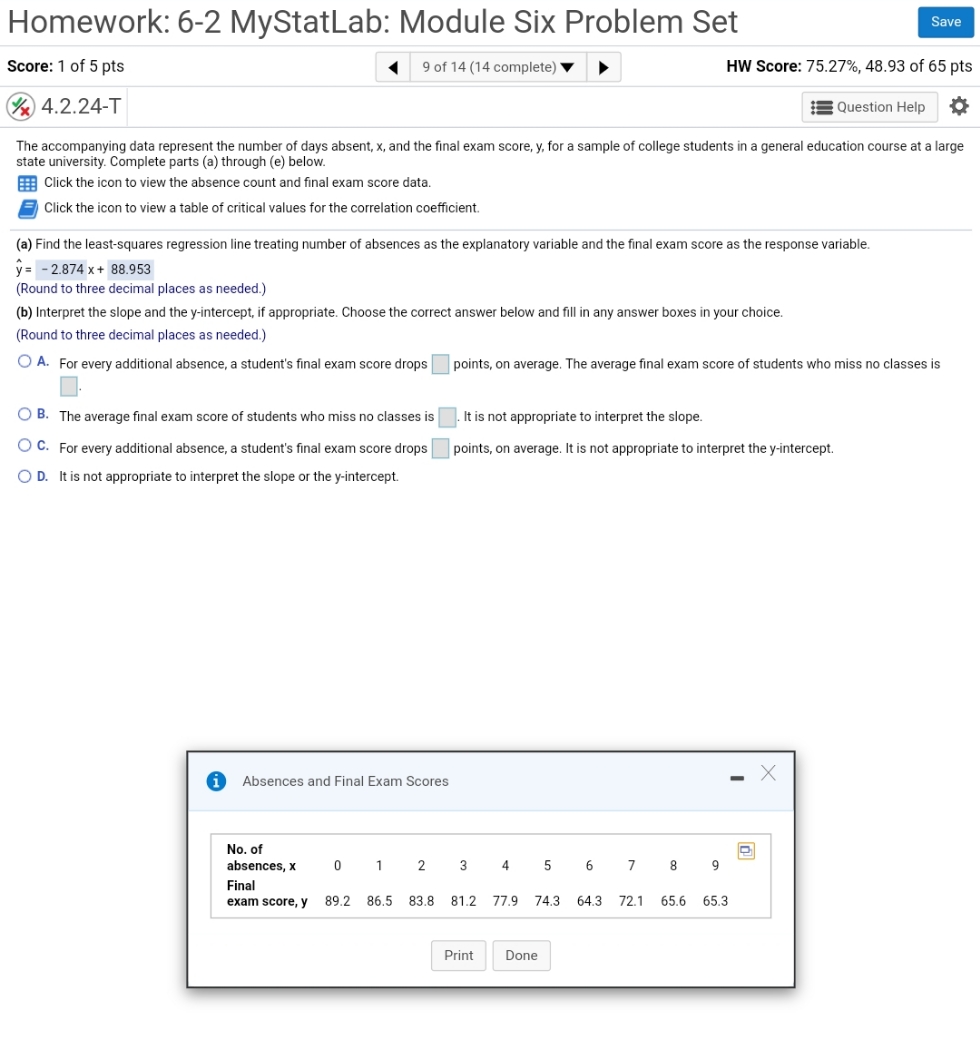
Homework: 6-2 MyStatLab: Module Six Problem Set Save Score: 1 of 5 pts 9 of 14 (14 complete) HW Score: 75.27%, 48.93 of 65 pts X 4.2.24-T Question Help The accompanying data represent the number of days absent, x, and the final exam score, y, for a sample of college students in a general education course at a large state university. Complete parts (a) through (e) below. Click the icon to view the absence count and final exam score data. Click the icon to view a table of critical values for the correlation coefficient (a) Find the least-squares regression line treating number of absences as the explanatory variable and the final exam score as the response variable. y= - 2.874 x + 88.953 (Round to three decimal places as needed.) (b) Interpret the slope and the y-intercept, if appropriate. Choose the correct answer below and fill in any answer boxes in your choice. (Round to three decimal places as needed.) A. For every additional absence, a student's final exam score drops |points, on average. The average final exam score of students who miss no classes is O B. The average final exam score of students who miss no classes is . It is not appropriate to interpret the slope. C. For every additional absence, a student's final exam score drops | |points, on average. It is not appropriate to interpret the y-intercept. O D. It is not appropriate to interpret the slope or the y-intercept. i Absences and Final Exam Scores - X No. of absences, x 0 1 2 3 5 6 7 8 9 2 Final exam score, y 89.2 8 86.5 83.8 81.2 77.9 74.3 64.3 72.1 65.6 65.3 Print Done
Step by Step Solution
There are 3 Steps involved in it

Get step-by-step solutions from verified subject matter experts