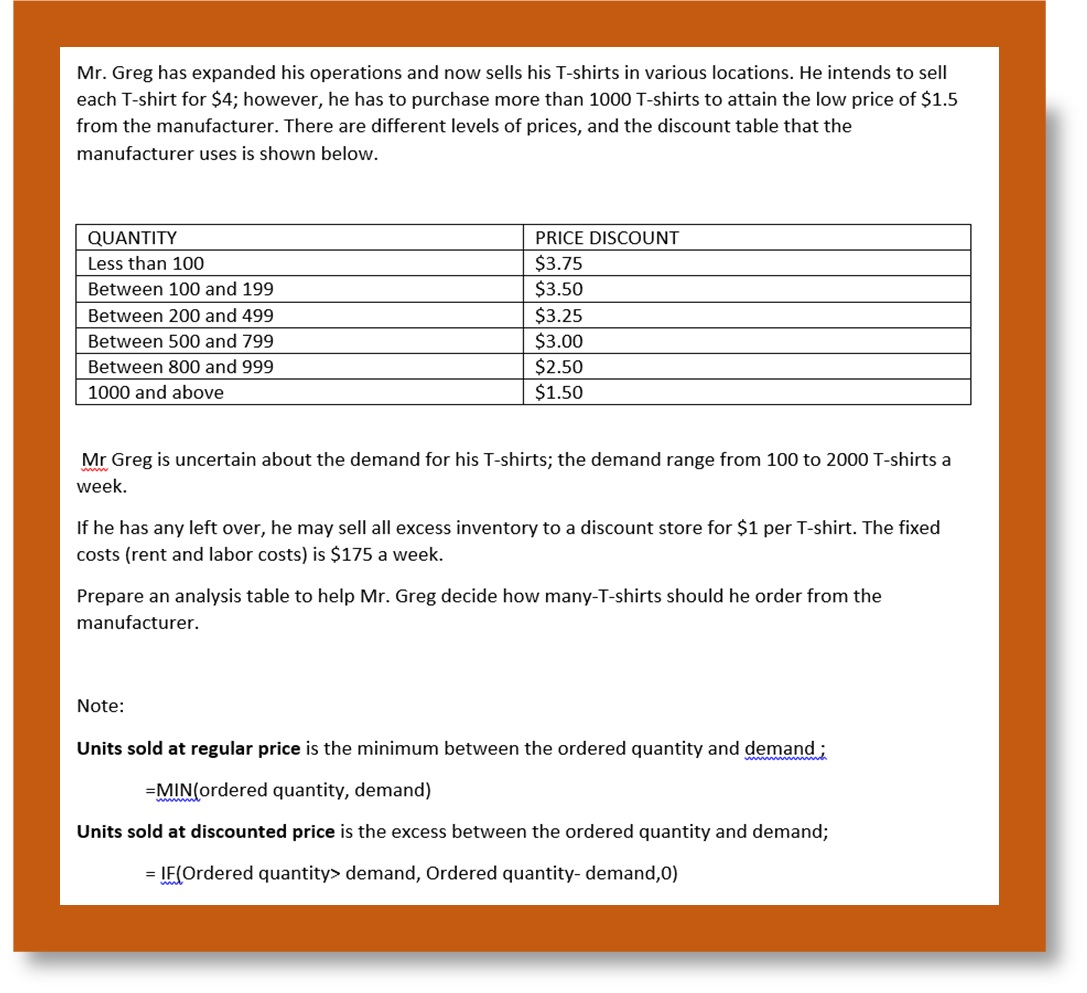
Question: Need help creating analysis in excel. Mr. Greg has expanded his operations and now sells his T-shirts in various locations. He intends to sell each

Need help creating analysis in excel. Mr. GregNeed help creating analysis in excel.

Mr. Greg has expanded his operations and now sells his T-shirts in various locations. He intends to sell each T-shirt for $4; however, he has to purchase more than 1000 T-shirts to attain the low price of $1.5 from the manufacturer. There are different levels of prices, and the discount table that the manufacturer uses is shown below. QUANTITY Less than 100 Between 100 and 199 Between 200 and 499 Between 500 and 799 Between 800 and 999 1000 and above PRICE DISCOUNT $3.75 $3.50 $3.25 $3.00 $2.50 $1.50 Mr Greg is uncertain about the demand for his T-shirts; the demand range from 100 to 2000 T-shirts a week. If he has any left over, he may sell all excess inventory to a discount store for $1 per T-shirt. The fixed costs (rent and labor costs) is $175 a week. Prepare an analysis table to help Mr. Greg decide how many-T-shirts should he order from the manufacturer. Note: Units sold at regular price is the minimum between the ordered quantity and demand; =MIN(ordered quantity, demand) Units sold at discounted price is the excess between the ordered quantity and demand; = IF(Ordered quantity> demand, Ordered quantity-demand,0)

Step by Step Solution

There are 3 Steps involved in it

1 Expert Approved Answer
Step: 1 Unlock blur-text-image
Question Has Been Solved by an Expert!

Get step-by-step solutions from verified subject matter experts

Step: 2 Unlock
Step: 3 Unlock

Students Have Also Explored These Related General Management Questions!