

Question: Need help creating PYTHON codes using functions to extract some statistics. Thank you in advance! Below are screenshots of notes to follow. Also, instructions/directions are
Need help creating PYTHON codes using functions to extract some statistics. Thank you in advance!
Below are screenshots of notes to follow. Also, instructions/directions are included and must be followed please and thank you.
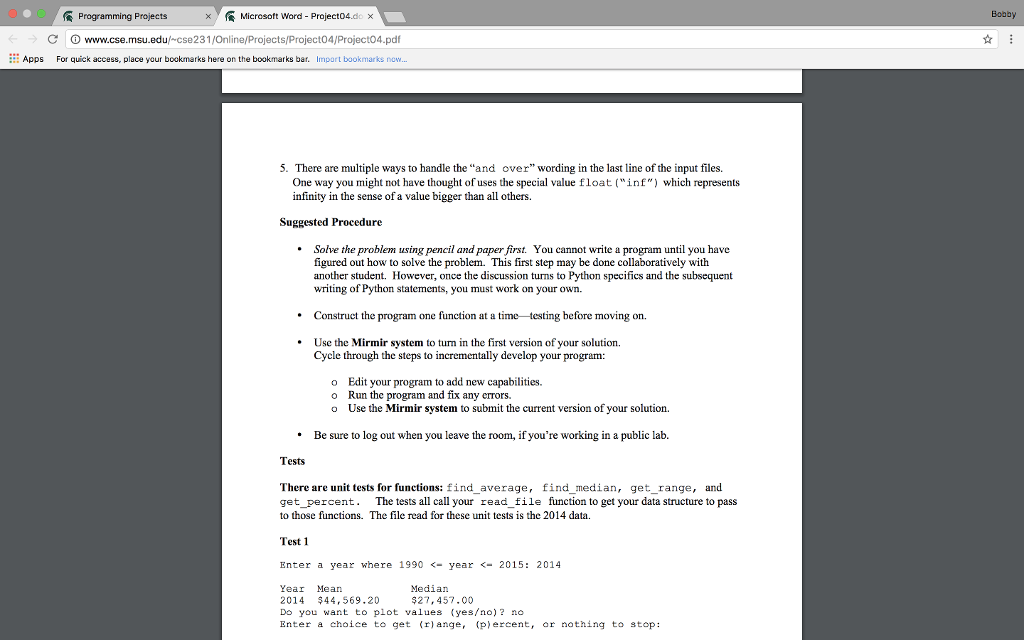
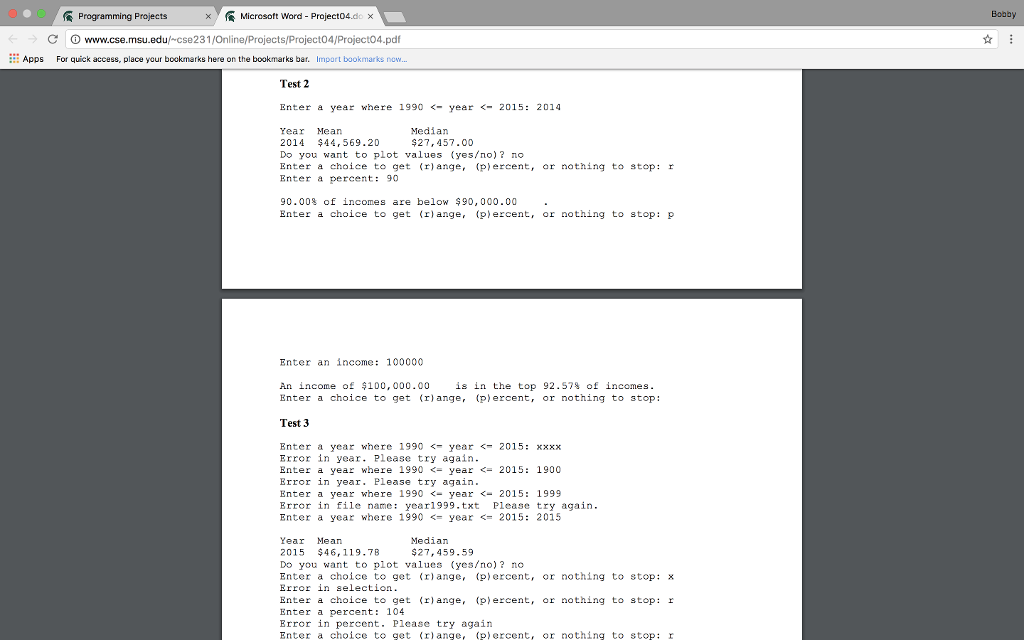
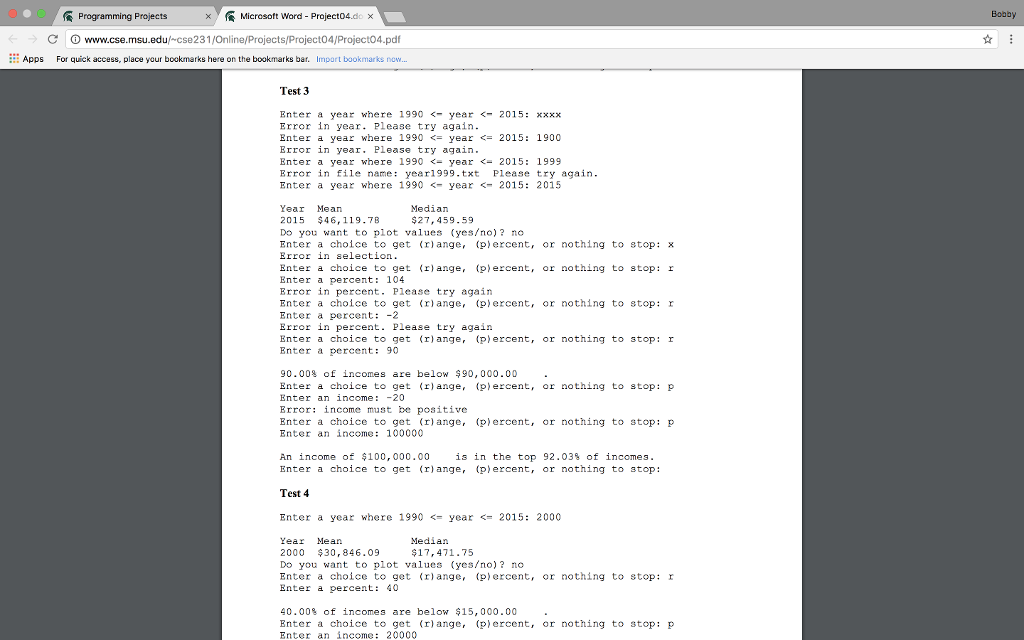
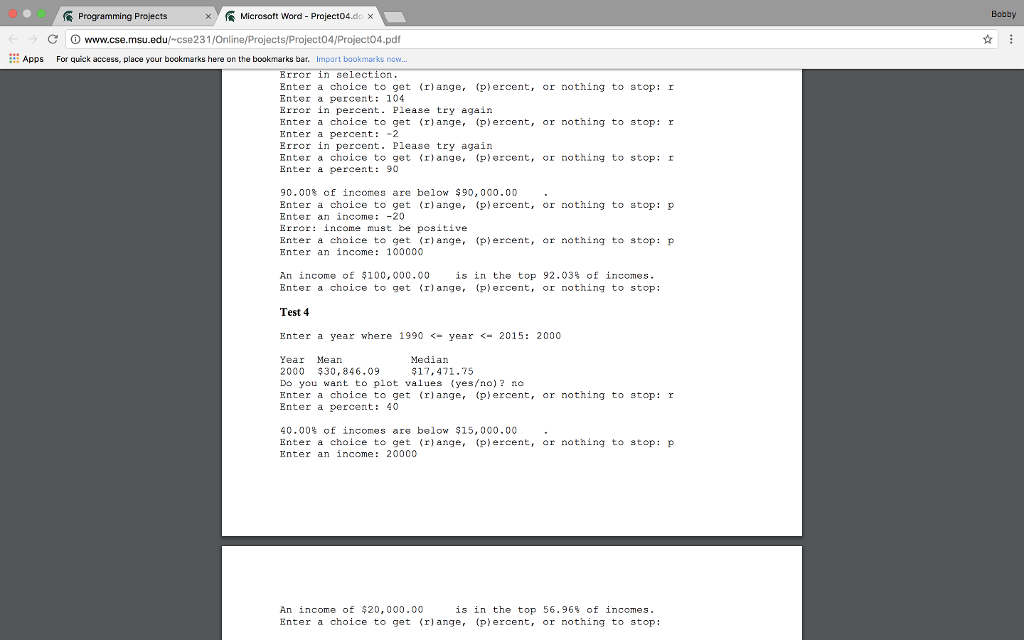
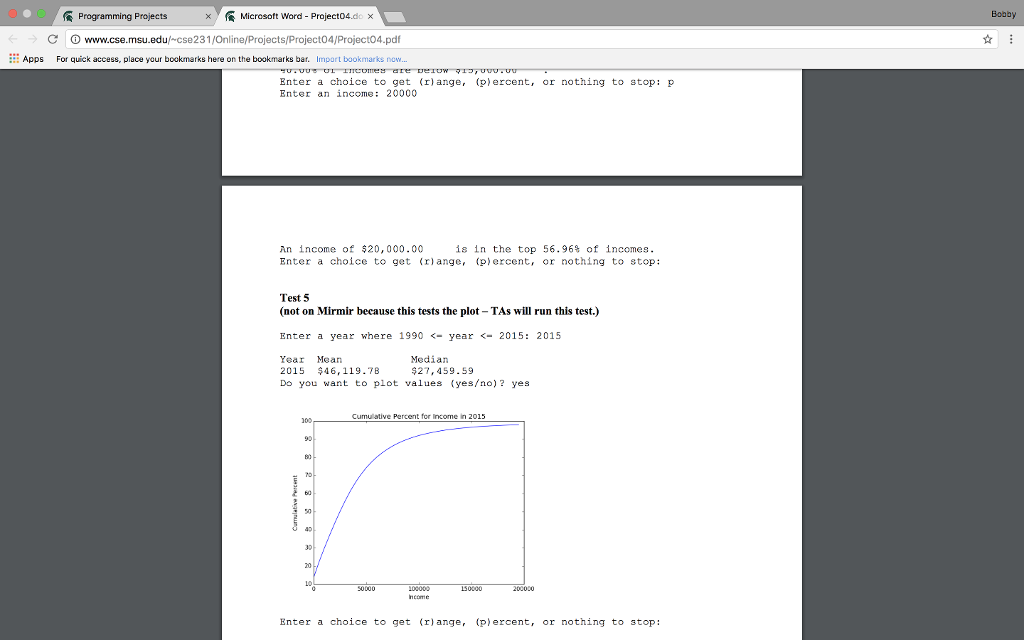
The sample output in multiple tests is also pictured below. Again thank you.
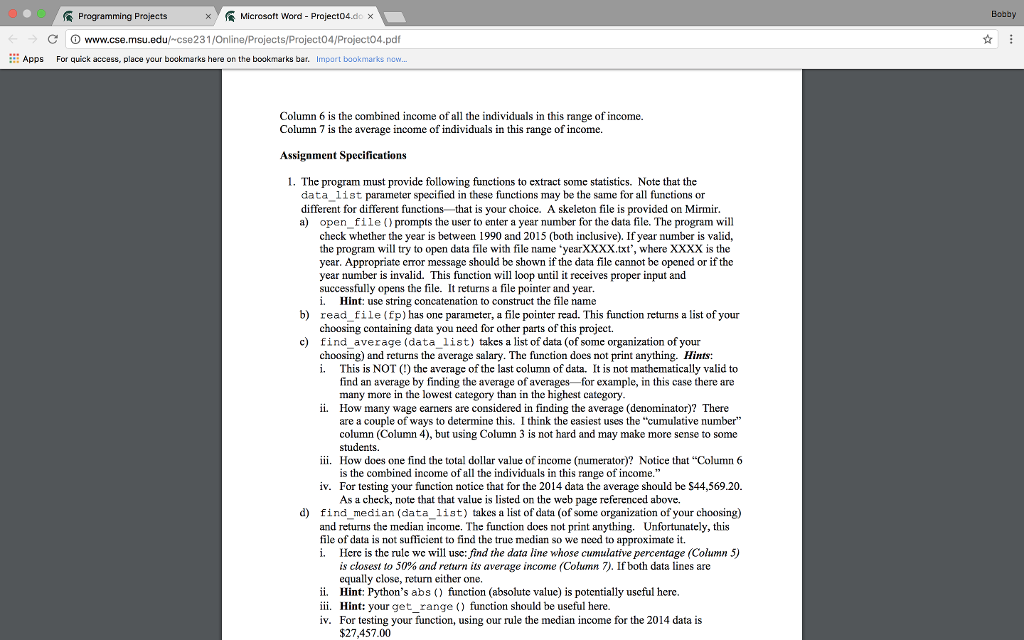
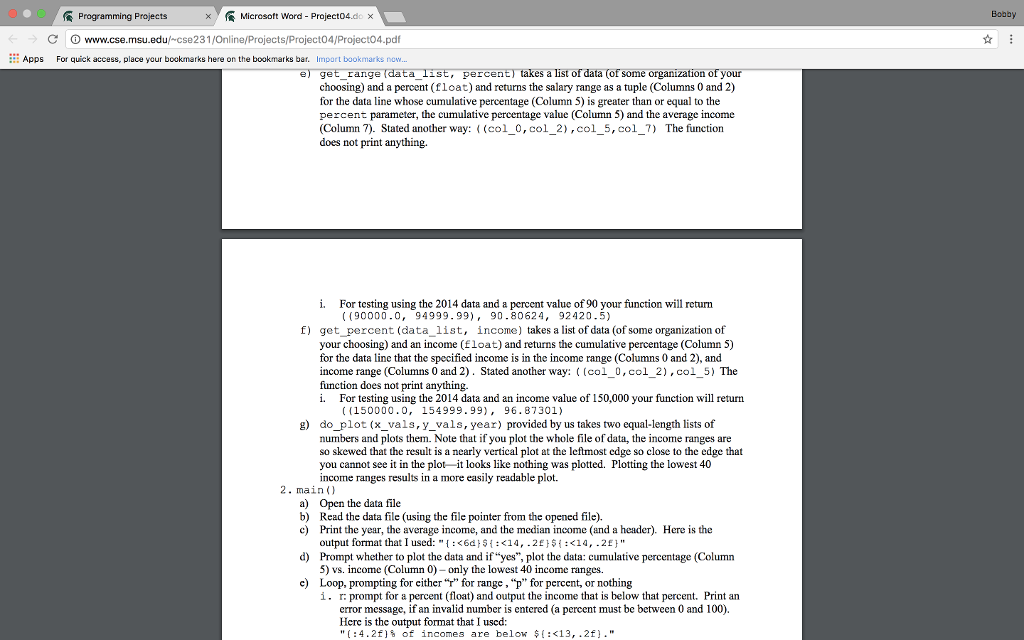
Instrcuctions and Directions.
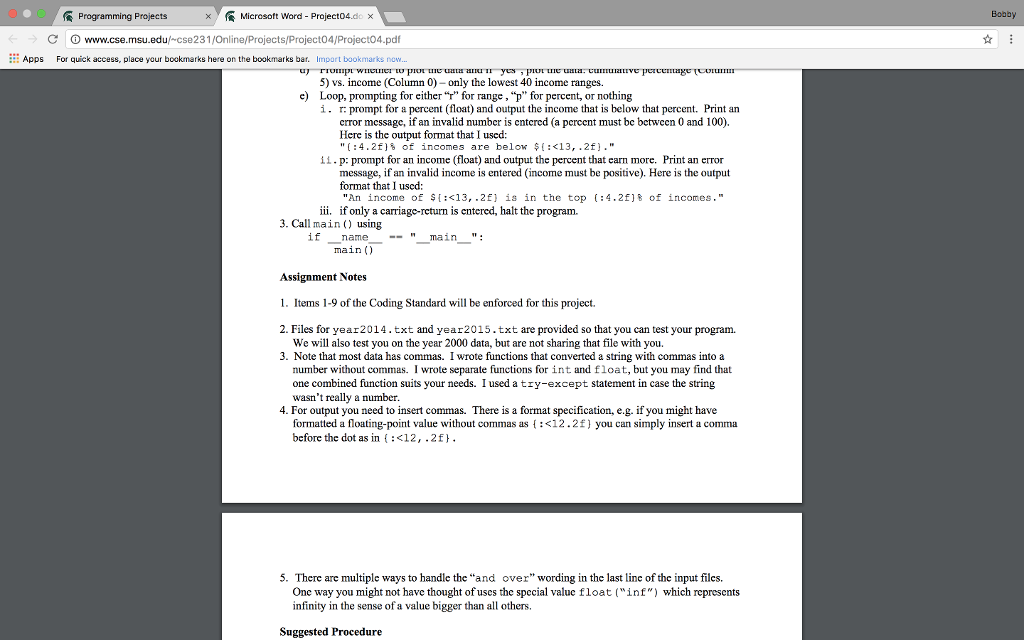
Suggestions, followed by sample test outputs.
Thank you again :)
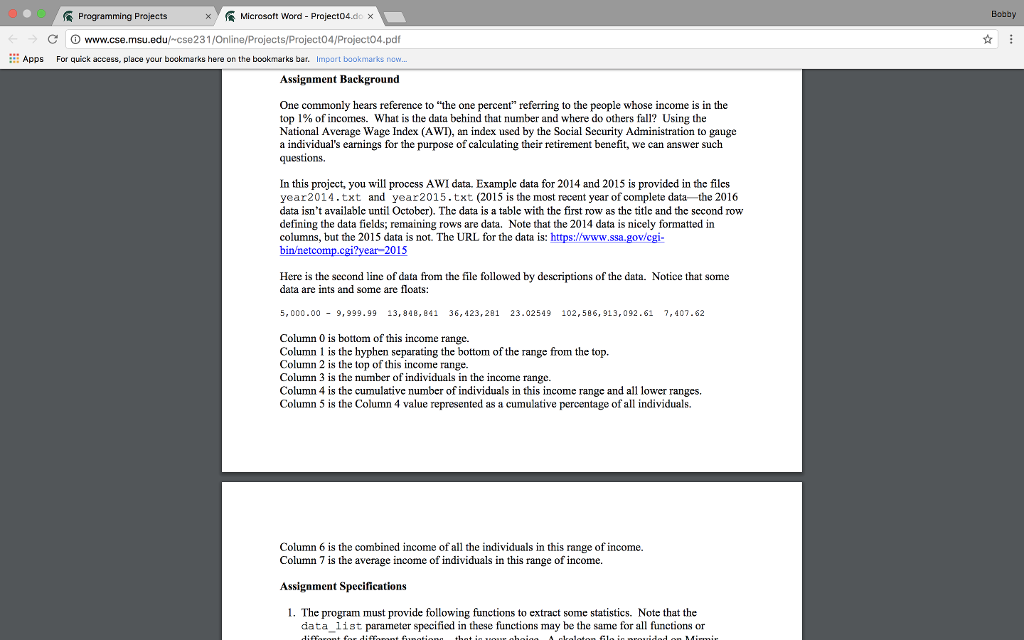
Programming Projects Microsoft Word Project C O www.cse.msu.ed 4/Projecto4.pdf Apps For quick access, place your bookma s here on bookmarks bar. mport bookmarks now. Assignment Background One commonly hears reference to "the one percent" referring to the people whose income is in the top 1% of incomes. What is the data behind that number and where do others fall? Using the National Average Wage Index (AWT, an index used by the Social Security Administration to gauge a individual's earnings for the purpose of calculating their retirement benefit, we can answer such questions. In this project, you will process AWI data. Example data for 2014 and 2015 is provided in the filcs year 2014.txt and year 2015.txt 2015 is the most recent year of complete data the 2016 data isn't available until October). The data is a table with the first row as thc titlc and the sccond row defining the data fields; remaining rows are data. Note that the 2014 data is nicely formatted in columns, but the 2015 data is not. The URL for the data is: https://www.ssa.gov/cgi- binnetcomp.cgi? at 2015 Here is the second line of data from the file followed by descriptions of the data. Notice that some data are ints and some are floats: 5,000 00 9,999 3, 84 B, B41 36, 123, 28 23.02549 102 86, 913, 092.6 7, 107 62 Column 0 is bottom of this income range. Column 1 is the hyphen separating the bottom of the range from the top Column 2 is the top of this income range. Column 3 is the number of individuals in the income range. Column 4 is the cumulative number of individuals in this income range and all lower ranges, Column 5 is the Column 4 value represented as a cumulative percentage of all individuals. Column 6 is the combined income of all the individuals in this range of income Column 7 is the average income of individuals in this range ofincome. Assignment Specifications l. The program must provide following functions to extract some statistics. Note that the data list, parameter specified in these functions may be the same for all functions or Bobby
Step by Step Solution
There are 3 Steps involved in it

Get step-by-step solutions from verified subject matter experts