

Question: Need help doing the graphs from the information given 15. On the first graph below depict the possible payoffs at the expiration of a call
Need help doing the graphs from the information given
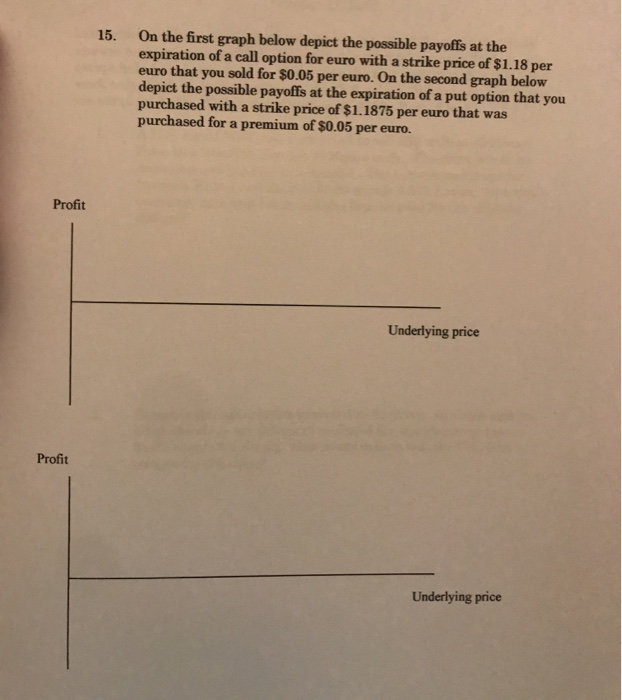
15. On the first graph below depict the possible payoffs at the expiration of a call option for euro with a strike price of $1.18 per euro that you sold for $0.05 per euro. On the second graph below depict the possible payoffs at the expiration of a put option that you purchased with a strike price of $1.1875 per euro that was purchased for a premium of $0.05 per euro. Profit Underlying price Profit Underlying price
Step by Step Solution
There are 3 Steps involved in it
1 Expert Approved Answer
Step: 1 Unlock

Question Has Been Solved by an Expert!
Get step-by-step solutions from verified subject matter experts
Step: 2 Unlock
Step: 3 Unlock