

Question: Need help figuring out the market characteristic lines/points and security market line. Having trouble doing the math for the second half (intercept, market beta, data
Need help figuring out the market characteristic lines/points and security market line. Having trouble doing the math for the second half (intercept, market beta, data points + the risk free rate, req. market return, market beta, investment req. & expected return, & difference for each of the investments. See screenshot attached below the first half of what I've completed (would like some confirmation that what I've got is correct so far and corrected if not) Please and thank you!
| Case 12 deals with basic financial risk concepts of a medical group practice facing alternative | |||||||
| investment opportunities. | |||||||
| The student version of the model is a format guide only because the objective is for students to attempt | |||||||
| basic calculations themselves. The key to student success in this case lies in correct calculations and | |||||||
| interpretation of the data. | |||||||
| Estimated one-year return distributions: | |||||||
| State of the | 1-Year | Healthcare | Inverse | Biotech | S&P | ||
| Economy | Probability | T-Bill | Fund | ETF | Fund | 500 | |
| Poor | 0.1 | 7% | -8% | 18% | -19% | -15% | |
| Below average | 0.2 | 7% | 2% | 23% | 0% | 0% | |
| Average | 0.4 | 7% | 14% | 7% | 13% | 15% | |
| Above average | 0.2 | 7% | 25% | -3% | 31% | 30% | |
| Excellent | 0.1 | 7% | 33% | 2% | 50% | 45% | |
| Historical return distributions: | |||||||
| 1-Year | Healthcare | Inverse | Biotech | S&P | |||
| T-Bill | Fund | ETF | Fund | 500 | |||
| Year 1 | 7% | -8% | 18% | -19% | -15% | ||
| Year 2 | 7% | 2% | 23% | 0% | 0% | ||
| Year 3 | 7% | 14% | 7% | 13% | 15% | ||
| Year 4 | 7% | 25% | -3% | 31% | 30% | ||
| Year 5 | 7% | 33% | 2% | 50% | 45% | ||
| Stand-alone return and risk: | |||||||
| 1-Year | Healthcare | Inverse | Biotech | S&P | |||
| T-Bill | Fund | ETF | Fund | 500 | |||
| Expected return [E(R)] | 7.0% | 13.5% | 8.8% | 14.5% | 15.0% | ||
| Variance (Var) | 0.0% | 221.3% | 94.7% | 573.2% | 450.0% | ||
| Standard deviation (SD) | 0.0% | 14.8% | 9.7% | 23.9% | 21.2% | ||
| Coefficient of variation (CV) | 0.00 | 1.12 | 1.04 | 1.60 | 1.40 | ||
| Portfolio return and risk: | |||||||
| E(R) of | E(R) of | ||||||
| Portfolio | Portfolio | ||||||
| State of the | Healthcare Fund / | Healthcare Fund / | |||||
| Economy | Inverse ETF | Biotech Fund | |||||
| Poor | -44.0% | 42.0% | |||||
| Below average | 8.7% | 0.0% | |||||
| Average | 2.0% | 1.1% | |||||
| Above average | -8.3% | 0.8% | |||||
| Excellent | 16.5% | 0.7% | |||||
| Portfolio | Portfolio | ||||||
| Healthcare Fund / | Healthcare Fund / | ||||||
| Inverse ETF | Biotech Fund | ||||||
| Expected return [E(R)] | 1.5% | 0.9% | |||||
| Variance (Var) | 2.3% | 0.4% | |||||
| Standard deviation (SD) | 1.5% | 0.6% | |||||
| Coefficient of variation (CV) | 1.07 | 0.70 | |||||
| Correlation coefficient | |||||||
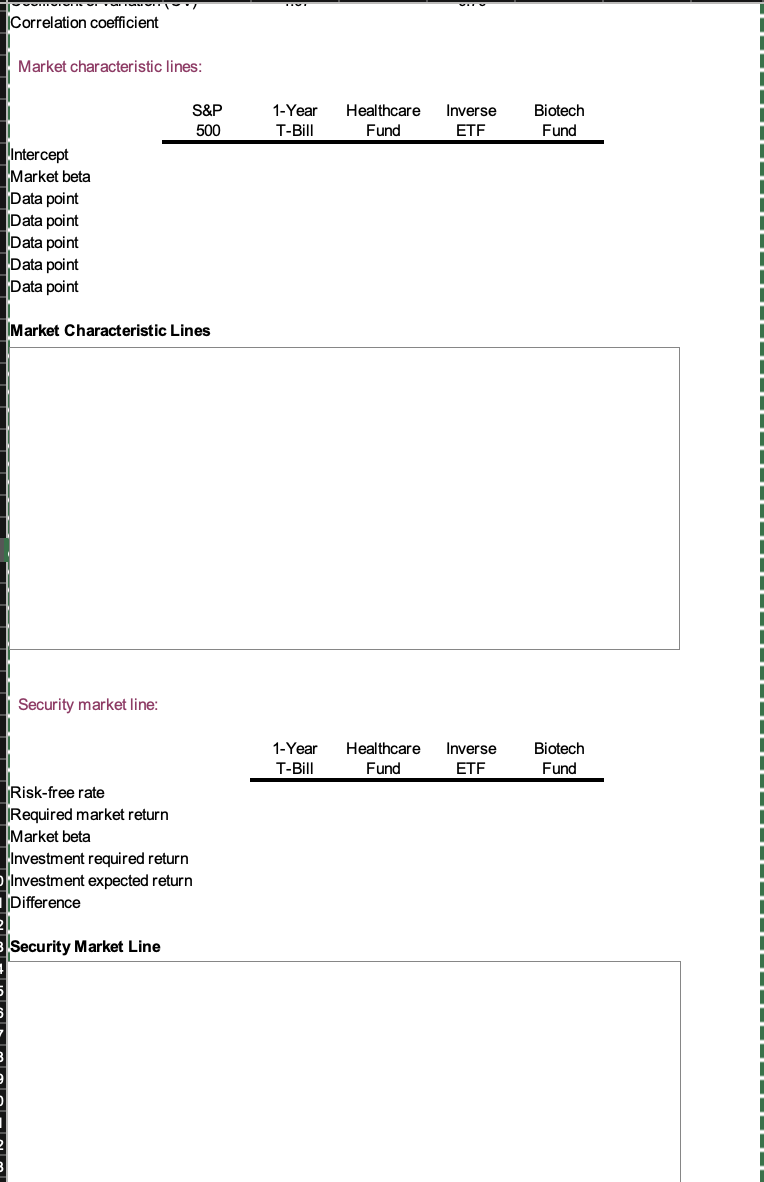
Correlation coefficient Market characteristic lines: S&P 500 1-Year T-Bill Healthcare Fund Inverse ETF Biotech Fund Intercept Market beta Data point Data point Data point Data point Data point Market Characteristic Lines Security market line: 1-Year T-Bill Healthcare Fund Inverse ETF Biotech Fund Risk-free rate Required market return Market beta Investment required return Investment expected return Difference Security Market Line Correlation coefficient Market characteristic lines: S&P 500 1-Year T-Bill Healthcare Fund Inverse ETF Biotech Fund Intercept Market beta Data point Data point Data point Data point Data point Market Characteristic Lines Security market line: 1-Year T-Bill Healthcare Fund Inverse ETF Biotech Fund Risk-free rate Required market return Market beta Investment required return Investment expected return Difference Security Market Line
Step by Step Solution
There are 3 Steps involved in it

Get step-by-step solutions from verified subject matter experts