

Question: Need help figuring out the market characteristic lines/points and security market line. I've already got the first half (attaching for reference, I THINK I did
Need help figuring out the market characteristic lines/points and security market line. I've already got the first half (attaching for reference, I THINK I did it right) but having trouble doing the math for the second half (intercept, market beta, data points + the risk free rate, req. market return, market beta, investment req. & expected return, & difference for each of the investments. See screenshot attached below the first half of what I've completed. Please and thank you!!
Edit: I've posted what I've got so far which I'm not sure if it is correct, however, everything shows up on my end. I'm not sure what is not showing up. There really isn't any more information to post as this is all there is.
| Estimated one-year return distributions: | ||||||
| State of the | 1-Year | Healthcare | Inverse | Biotech | S&P | |
| Economy | Probability | T-Bill | Fund | ETF | Fund | 500 |
| Poor | 0.1 | 7% | -8% | 18% | -19% | -15% |
| Below average | 0.2 | 7% | 2% | 23% | 0% | 0% |
| Average | 0.4 | 7% | 14% | 7% | 13% | 15% |
| Above average | 0.2 | 7% | 25% | -3% | 31% | 30% |
| Excellent | 0.1 | 7% | 33% | 2% | 50% | 45% |
| Historical return distributions: | ||||||
| 1-Year | Healthcare | Inverse | Biotech | S&P | ||
| T-Bill | Fund | ETF | Fund | 500 | ||
| Year 1 | 7% | -8% | 18% | -19% | -15% | |
| Year 2 | 7% | 2% | 23% | 0% | 0% | |
| Year 3 | 7% | 14% | 7% | 13% | 15% | |
| Year 4 | 7% | 25% | -3% | 31% | 30% | |
| Year 5 | 7% | 33% | 2% | 50% | 45% | |
| Stand-alone return and risk: | ||||||
| 1-Year | Healthcare | Inverse | Biotech | S&P | ||
| T-Bill | Fund | ETF | Fund | 500 | ||
| Expected return [E(R)] | 7.0% | 13.5% | 8.8% | 14.5% | 15.0% | |
| Variance (Var) | 0.0% | 221.3% | 94.7% | 573.2% | 450.0% | |
| Standard deviation (SD) | 0.0% | 14.8% | 9.7% | 23.9% | 21.2% | |
| Coefficient of variation (CV) | 0.00 | 1.12 | 1.04 | 1.60 | 1.40 | |
| Portfolio return and risk: | ||||||
| E(R) of | E(R) of | |||||
| Portfolio | Portfolio | |||||
| State of the | Healthcare Fund / | Healthcare Fund / | ||||
| Economy | Inverse ETF | Biotech Fund | ||||
| Poor | -44.0% | 42.0% | ||||
| Below average | 8.7% | 0.0% | ||||
| Average | 2.0% | 1.1% | ||||
| Above average | -8.3% | 0.8% | ||||
| Excellent | 16.5% | 0.7% | ||||
| Portfolio | Portfolio | |||||
| Healthcare Fund / | Healthcare Fund / | |||||
| Inverse ETF | Biotech Fund | |||||
| Expected return [E(R)] | 1.5% | 0.9% | ||||
| Variance (Var) | 2.3% | 0.4% | ||||
| Standard deviation (SD) | 1.5% | 0.6% | ||||
| Coefficient of variation (CV) | 1.07 | 0.70 | ||||
| Correlation coefficient | ||||||
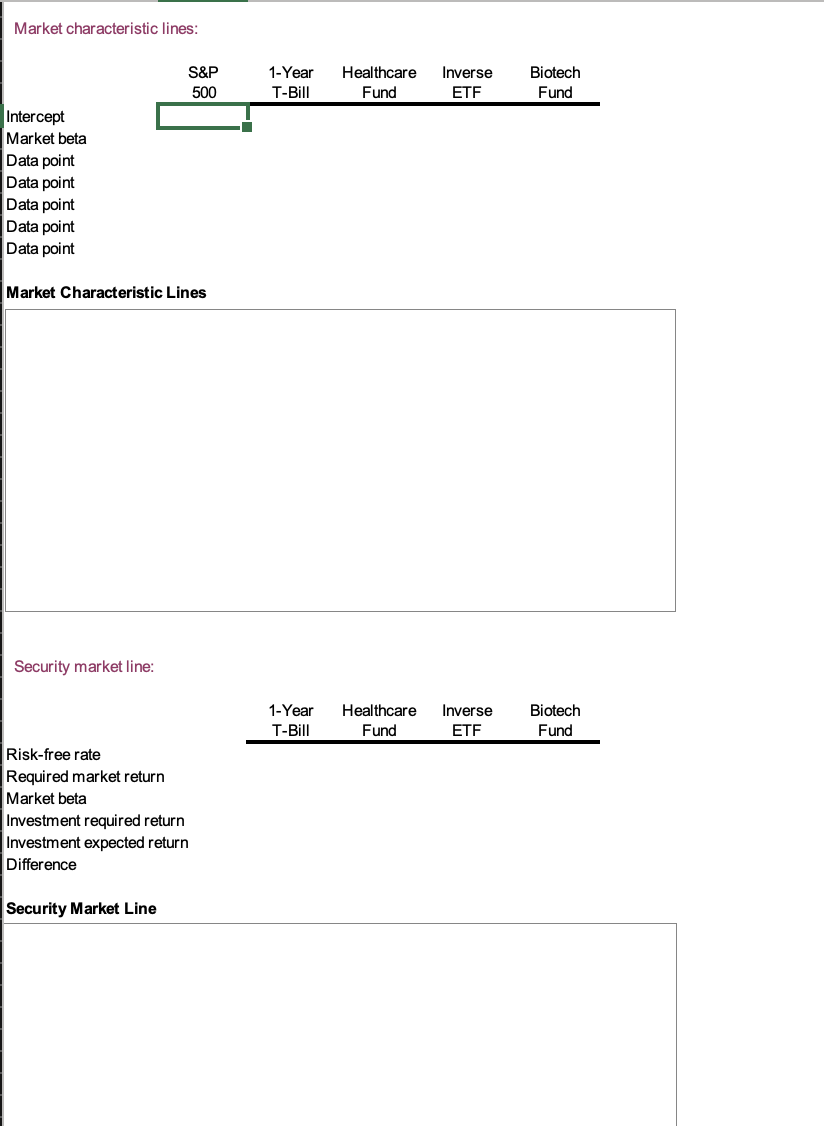
Market characteristic lines: S&P 500 1-Year T-Bill Healthcare Fund Inverse ETF Biotech Fund Intercept Market beta Data point Data point Data point Data point Data point Market Characteristic Lines Security market line: 1-Year T-Bill Healthcare Fund Inverse ETF Biotech Fund Risk-free rate Required market return Market beta Investment required return Investment expected return Difference Security Market Line Market characteristic lines: S&P 500 1-Year T-Bill Healthcare Fund Inverse ETF Biotech Fund Intercept Market beta Data point Data point Data point Data point Data point Market Characteristic Lines Security market line: 1-Year T-Bill Healthcare Fund Inverse ETF Biotech Fund Risk-free rate Required market return Market beta Investment required return Investment expected return Difference Security Market Line
Step by Step Solution
There are 3 Steps involved in it

Get step-by-step solutions from verified subject matter experts