Question: need help filling out statement sheets and with how to get each answer with formulas. PR 21-6A Contribution margin, break-even sales, cost-volume-profit chart, margin of
need help filling out statement sheets and with how to get each answer with formulas.
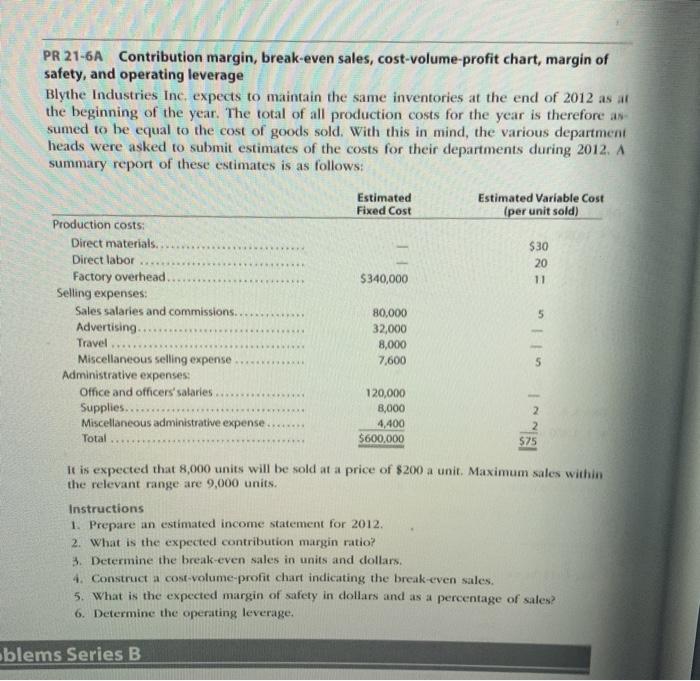
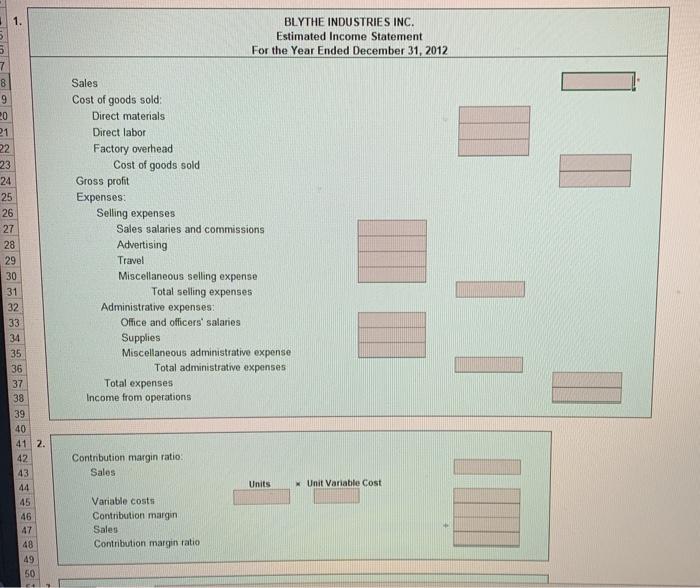
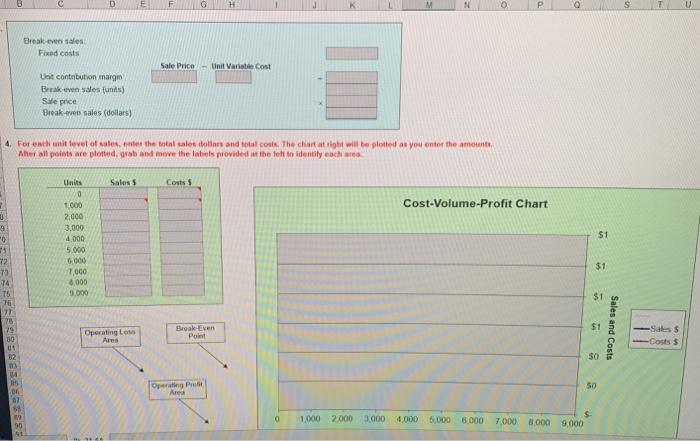
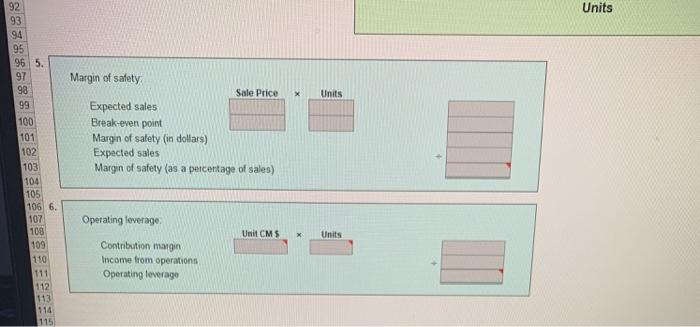
PR 21-6A Contribution margin, break-even sales, cost-volume-profit chart, margin of safety, and operating leverage Blythe Industries Inc, expects to maintain the same inventories at the end of 2012 as at the beginning of the year. The total of all production costs for the year is therefore an sumed to be equal to the cost of goods sold. With this in mind, the various department heads were asked to submit estimates of the costs for their departments during 2012. A summary report of these estimates is as follows: Estimated Fixed Cost Estimated Variable Cost (per unit sold) Production costs: Direct materials. Direct labor Factory overhead Selling expenses: Sales salaries and commissions.... Advertising. $30 20 11 $340,000 5 ***** Travel 80,000 32,000 8,000 7,600 *** Miscellaneous selling expense Administrative expenses: Office and officers' salaries Supplies.... Miscellaneous administrative expense.. Total 120,000 8,000 4,400 $600,000 575 It is expected that 8,000 units will be sold at a price of $200 a unit. Maximum sales within the relevant range are 9,000 units. Instructions 1. Prepare an estimated income statement for 2012 2. What is the expected contribution margin ratio? 3. Determine the break-even sales in units and dollars. 4. Construct a cost-volume-profit chart indicating the break-even sales. 5. What is the expected margin of safety in dollars and as a percentage of sales? 6. Determine the operating leverage. blems Series B BLYTHE INDUSTRIES INC. Estimated Income Statement For the Year Ended December 31, 2012 5 7 8 9 20 21 22 23 24 25 26 27 28 29 30 31 32 33 34 35 36 37 38 39 40 41 2. 42 43 44 45 46 47 48 49 50 Sales Cost of goods sold Direct materials Direct labor Factory overhead Cost of goods sold Gross profit Expenses Selling expenses Sales salaries and commissions Advertising Travel Miscellaneous selling expense Total selling expenses Administrative expenses Office and officers' salaries Supplies Miscellaneous administrative expense Total administrative expenses Total expenses Income from operations Contribution margin ratio: Sales Units x Unit Variable Cost Variable costs Contribution margin Sales Contribution margin ratio 8 F G H N Break-evale Fored costs Sale Price Unit Variatie Cost Ut contribution margm Berak even sales units) Sale price Break even sales (dollars) 4. For each unit level of sales, the total sales dollars and total costs. The chart at right will be plotted as you enter the amounts, Aller all points are ploited, grab and move the labels provided the left to identity eaches Sales Costs Units 0 1000 Cost-Volume-Profit Chart 2.000 9 0 $1 3.000 4000 5.000 0.000 7.000 8.000 9.000 12 73 74 TS $1 $1 $1 77 78 79 30 00 82 03 Operating Loss Ains Break Even Pole Sales and Costs Sales Gosts 30 115 DE Operating i Are 50 0 1,000 2,000 3000 4000 5,000 29 50 91 6.000 7.000.000 9,000 Units x Units 92 93 94 95 96 5. 97 98 99 100 101 102 103 104 105 106 6. 107 108 109 110 111 112 113 114 115 Margin of safety Sale Price Expected sales Break-even point Margin of safety (in dollars) Expected sales Margin of safety (as a percentage of sales) Operating leverage Unit CMS Units Contribution margin Income from operations Operating leverage PR 21-6A Contribution margin, break-even sales, cost-volume-profit chart, margin of safety, and operating leverage Blythe Industries Inc, expects to maintain the same inventories at the end of 2012 as at the beginning of the year. The total of all production costs for the year is therefore an sumed to be equal to the cost of goods sold. With this in mind, the various department heads were asked to submit estimates of the costs for their departments during 2012. A summary report of these estimates is as follows: Estimated Fixed Cost Estimated Variable Cost (per unit sold) Production costs: Direct materials. Direct labor Factory overhead Selling expenses: Sales salaries and commissions.... Advertising. $30 20 11 $340,000 5 ***** Travel 80,000 32,000 8,000 7,600 *** Miscellaneous selling expense Administrative expenses: Office and officers' salaries Supplies.... Miscellaneous administrative expense.. Total 120,000 8,000 4,400 $600,000 575 It is expected that 8,000 units will be sold at a price of $200 a unit. Maximum sales within the relevant range are 9,000 units. Instructions 1. Prepare an estimated income statement for 2012 2. What is the expected contribution margin ratio? 3. Determine the break-even sales in units and dollars. 4. Construct a cost-volume-profit chart indicating the break-even sales. 5. What is the expected margin of safety in dollars and as a percentage of sales? 6. Determine the operating leverage. blems Series B BLYTHE INDUSTRIES INC. Estimated Income Statement For the Year Ended December 31, 2012 5 7 8 9 20 21 22 23 24 25 26 27 28 29 30 31 32 33 34 35 36 37 38 39 40 41 2. 42 43 44 45 46 47 48 49 50 Sales Cost of goods sold Direct materials Direct labor Factory overhead Cost of goods sold Gross profit Expenses Selling expenses Sales salaries and commissions Advertising Travel Miscellaneous selling expense Total selling expenses Administrative expenses Office and officers' salaries Supplies Miscellaneous administrative expense Total administrative expenses Total expenses Income from operations Contribution margin ratio: Sales Units x Unit Variable Cost Variable costs Contribution margin Sales Contribution margin ratio 8 F G H N Break-evale Fored costs Sale Price Unit Variatie Cost Ut contribution margm Berak even sales units) Sale price Break even sales (dollars) 4. For each unit level of sales, the total sales dollars and total costs. The chart at right will be plotted as you enter the amounts, Aller all points are ploited, grab and move the labels provided the left to identity eaches Sales Costs Units 0 1000 Cost-Volume-Profit Chart 2.000 9 0 $1 3.000 4000 5.000 0.000 7.000 8.000 9.000 12 73 74 TS $1 $1 $1 77 78 79 30 00 82 03 Operating Loss Ains Break Even Pole Sales and Costs Sales Gosts 30 115 DE Operating i Are 50 0 1,000 2,000 3000 4000 5,000 29 50 91 6.000 7.000.000 9,000 Units x Units 92 93 94 95 96 5. 97 98 99 100 101 102 103 104 105 106 6. 107 108 109 110 111 112 113 114 115 Margin of safety Sale Price Expected sales Break-even point Margin of safety (in dollars) Expected sales Margin of safety (as a percentage of sales) Operating leverage Unit CMS Units Contribution margin Income from operations Operating leverage