

Question: I need help with number 4 only please OBJ. 2,3,4,5 2. 62.5% Search PR 21-6A Contribution margin, break-even sales, cost-volume-profit chart, margin of safety, and
 I need help with number 4 only please
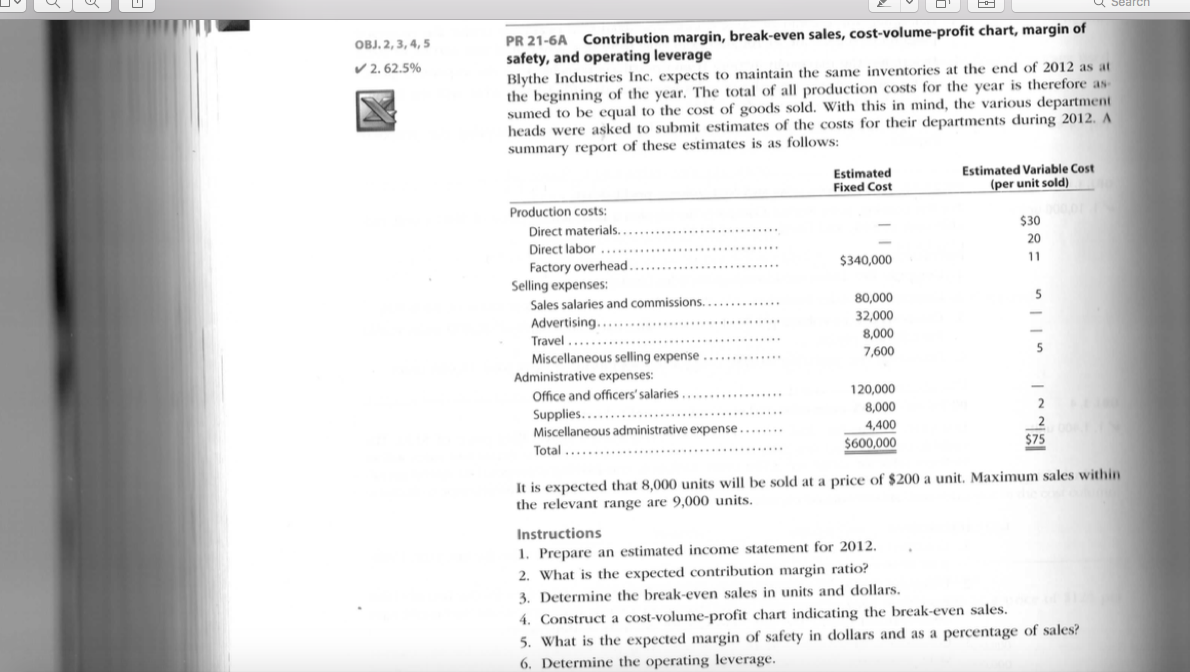
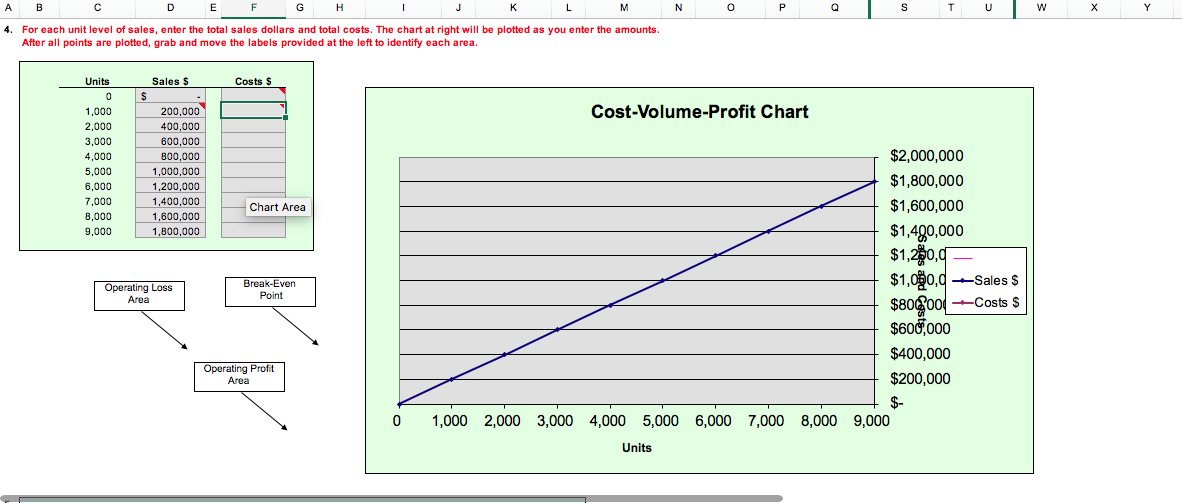
OBJ. 2,3,4,5 2. 62.5% Search PR 21-6A Contribution margin, break-even sales, cost-volume-profit chart, margin of safety, and operating leverage Blythe Industries Inc, expects to maintain the same inventories at the end of 2012 as at the beginning of the year. The total of all production costs for the year is therefore as sumed to be equal to the cost of goods sold. With this in mind, the various department heads were asked to submit estimates of the costs for their departments during 2012. A summary report of these estimates is as follows: Estimated Fixed Cost Estimated Variable Cost (per unit sold) $30 $340,000 Production costs: Direct materials.......... Direct labor.. Factory overhead..................... Selling expenses: Sales salaries and commissions... Advertising... Travel ..... Miscellaneous selling expense ......... Administrative expenses: Office and officers' salaries ...... Supplies............. Miscellaneous administrative expense........ Total ............... . 80,000 32,000 8,000 7,600 120,000 8,000 4,400 $600,000 It is expected that 8,000 units will be sold at a price of $200 a unit. Maximum sales within the relevant range are 9,000 units. Instructions 1. Prepare an estimated income statement for 2012. 2. What is the expected contribution margin ratio? 3. Determine the break-even sales in units and dollars. 4. Construct a cost-volume-profit chart indicating the break-even sales. 5. What is the expected margin of safety in dollars and as a percentage of sales? 6. Determine the operating leverage. AB LM N O P Q S T U W X Y 4. For each unit level of sales, enter the total sales dollars and total costs. The chart at right will be plotted as you enter the amounts. After all points are plotted, grab and move the labels provided at the left to identify each area. Units Sales $ Costs $ Cost-Volume-Profit Chart 1,000 2,000 3,000 4,000 5,000 6,000 7,000 8.000 9,000 200,000 400,000 600,000 800,000 1,000,000 1,200,000 1,400,000 1,600,000 1,800,000 Chart Area $2,000,000 $1,800,000 $1,600,000 $1,490,000 $1,280,9 $1,080, $80200 $600,000 $400,000 $200,000 Operating Loss Area Break-Even Point Sales $ Costs $ Operating Profit Area 0 7,000 8,000 9,000 1,000 2,000 3,000 4,000 5,000 6,000 Units
Step by Step Solution
There are 3 Steps involved in it

Get step-by-step solutions from verified subject matter experts