

Question: need help finishing this. please check my work and provide explanations and formulas. 5 0 (Current) 2022 1 2023 2 2024 3 2025 2021 2026
need help finishing this. please check my work and provide explanations and formulas.
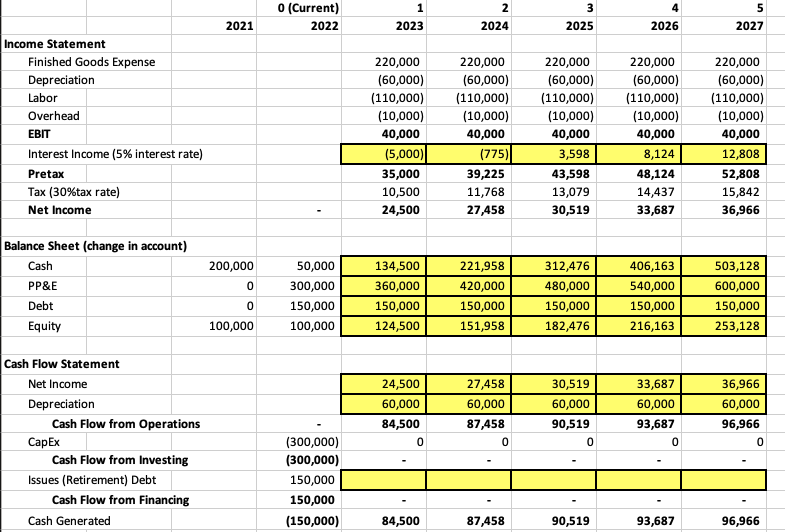
5 0 (Current) 2022 1 2023 2 2024 3 2025 2021 2026 2027 Income Statement Finished Goods Expense Depreciation Labor Overhead EBIT Interest Income (5% interest rate) Pretax Tax (30%tax rate) Net Income 220,000 (60,000) (110,000) (10,000) 40,000 (5,000) 35,000 10,500 24,500 220,000 (60,000) (110,000) (10,000) 40,000 (775) 39,225 11,768 27,458 220,000 (60,000) (110,000) (10,000) 40,000 3,598 43,598 13,079 30,519 220,000 (60,000) (110,000) (10,000) 40,000 8,124 48,124 14,437 33,687 220,000 (60,000) (110,000) (10,000) 40,000 12,808 52,808 15,842 36,966 Balance Sheet (change in account) Cash PP&E 200,000 0 0 100,000 50,000 300,000 150,000 100,000 134,500 360,000 150,000 124,500 221,958 420,000 150,000 151,958 312,476 480,000 150,000 182,476 406,163 540,000 150,000 216,163 503,128 600,000 150,000 253,128 Debt Equity Cash Flow Statement Net Income Depreciation Cash Flow from Operations Capex Cash Flow from Investing Issues (Retirement) Debt Cash Flow from Financing Cash Generated 24,500 60,000 84,500 0 27,458 60,000 87,458 0 30,519 60,000 90,519 0 33,687 60,000 93,687 0 36,966 60,000 96,966 0 (300,000) (300,000) 150,000 150,000 (150,000) 84,500 87,458 90,519 93,687 96,966 5 0 (Current) 2022 1 2023 2 2024 3 2025 2021 2026 2027 Income Statement Finished Goods Expense Depreciation Labor Overhead EBIT Interest Income (5% interest rate) Pretax Tax (30%tax rate) Net Income 220,000 (60,000) (110,000) (10,000) 40,000 (5,000) 35,000 10,500 24,500 220,000 (60,000) (110,000) (10,000) 40,000 (775) 39,225 11,768 27,458 220,000 (60,000) (110,000) (10,000) 40,000 3,598 43,598 13,079 30,519 220,000 (60,000) (110,000) (10,000) 40,000 8,124 48,124 14,437 33,687 220,000 (60,000) (110,000) (10,000) 40,000 12,808 52,808 15,842 36,966 Balance Sheet (change in account) Cash PP&E 200,000 0 0 100,000 50,000 300,000 150,000 100,000 134,500 360,000 150,000 124,500 221,958 420,000 150,000 151,958 312,476 480,000 150,000 182,476 406,163 540,000 150,000 216,163 503,128 600,000 150,000 253,128 Debt Equity Cash Flow Statement Net Income Depreciation Cash Flow from Operations Capex Cash Flow from Investing Issues (Retirement) Debt Cash Flow from Financing Cash Generated 24,500 60,000 84,500 0 27,458 60,000 87,458 0 30,519 60,000 90,519 0 33,687 60,000 93,687 0 36,966 60,000 96,966 0 (300,000) (300,000) 150,000 150,000 (150,000) 84,500 87,458 90,519 93,687 96,966
Step by Step Solution
There are 3 Steps involved in it

Get step-by-step solutions from verified subject matter experts