

Question: Need help from ques 5 to 8c. Please show work. Apply a custom format to cell b14 to display the text Units Sold/Price in place
Need help from ques 5 to 8c. Please show work.
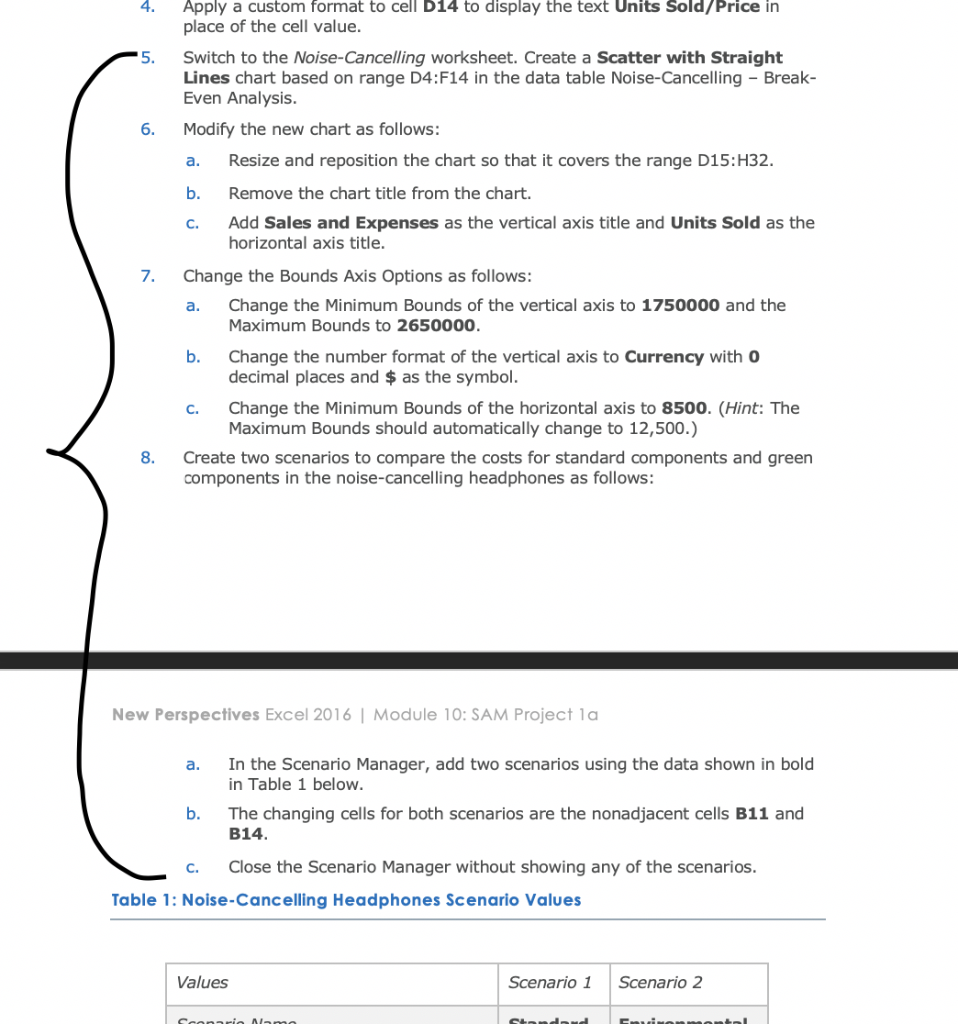
Apply a custom format to cell b14 to display the text Units Sold/Price in place of the cell value. Switch to the Noise-Cancelling worksheet. Create a Scatter with Straight Lines chart based on range D4:F14 in the data table Noise-Cancelling - Break- Even Analysis. Modify the new chart as follows: a. Resize and reposition the chart so that it covers the range D15:H32. b. Remove the chart title from the chart. Add Sales and Expenses as the vertical axis title and Units Sold as the horizontal axis title. Change the Bounds Axis Options as follows: a. Change the Minimum Bounds of the vertical axis to 1750000 and the Maximum Bounds to 2650000. b. Change the number format of the vertical axis to Currency with o decimal places and $ as the symbol. c. Change the Minimum Bounds of the horizontal axis to 8500. (Hint: The Maximum Bounds should automatically change to 12,500.) Create two scenarios to compare the costs for standard components and green components in the noise-cancelling headphones as follows: 8. New Perspectives Excel 2016 | Module 10: SAM Project la a. In the Scenario Manager, add two scenarios using the data shown in bold in Table 1 below. The changing cells for both scenarios are the nonadjacent cells B11 and B14. Close the Scenario Manager without showing any of the scenarios. Table 1: Noise-Cancelling Headphones Scenario Values Values Scenario 1 Scenario 2 Can Almaa Sud ENRI Apply a custom format to cell b14 to display the text Units Sold/Price in place of the cell value. Switch to the Noise-Cancelling worksheet. Create a Scatter with Straight Lines chart based on range D4:F14 in the data table Noise-Cancelling - Break- Even Analysis. Modify the new chart as follows: a. Resize and reposition the chart so that it covers the range D15:H32. b. Remove the chart title from the chart. Add Sales and Expenses as the vertical axis title and Units Sold as the horizontal axis title. Change the Bounds Axis Options as follows: a. Change the Minimum Bounds of the vertical axis to 1750000 and the Maximum Bounds to 2650000. b. Change the number format of the vertical axis to Currency with o decimal places and $ as the symbol. c. Change the Minimum Bounds of the horizontal axis to 8500. (Hint: The Maximum Bounds should automatically change to 12,500.) Create two scenarios to compare the costs for standard components and green components in the noise-cancelling headphones as follows: 8. New Perspectives Excel 2016 | Module 10: SAM Project la a. In the Scenario Manager, add two scenarios using the data shown in bold in Table 1 below. The changing cells for both scenarios are the nonadjacent cells B11 and B14. Close the Scenario Manager without showing any of the scenarios. Table 1: Noise-Cancelling Headphones Scenario Values Values Scenario 1 Scenario 2 Can Almaa Sud ENRI
Step by Step Solution
There are 3 Steps involved in it

Get step-by-step solutions from verified subject matter experts