

Question: Need help in these problem For the data of Exercise 1.4 on page 13, compute both the mean and the variance in flexibility for both
Need help in these problem
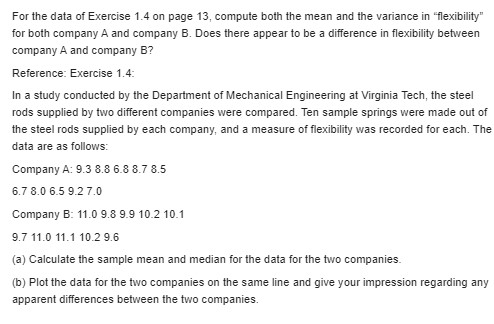
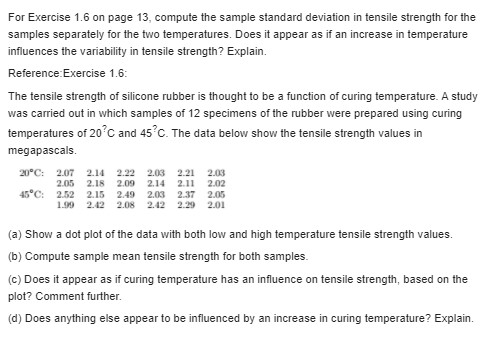

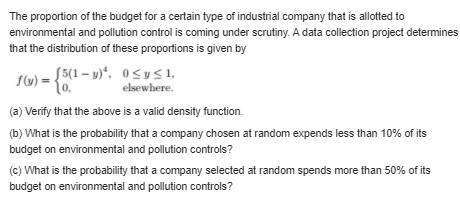
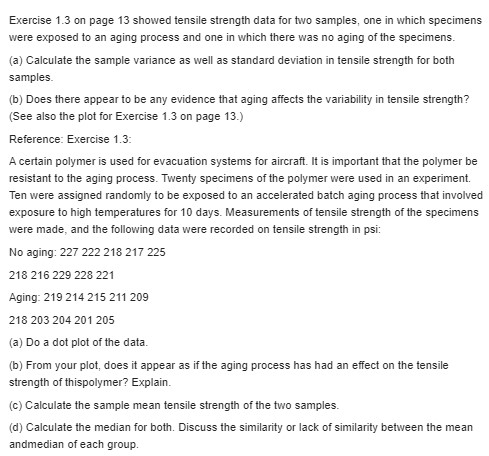
For the data of Exercise 1.4 on page 13, compute both the mean and the variance in "flexibility" for both company A and company B. Does there appear to be a difference in flexibility between company A and company B? Reference: Exercise 1.4: In a study conducted by the Department of Mechanical Engineering at Virginia Tech, the steel rods supplied by two different companies were compared. Ten sample springs were made out of the steel rods supplied by each company, and a measure of flexibility was recorded for each. The data are as follows: Company A: 9.3 8.8 6.8 8.7 8.5 6.7 8.0 6.59.27.0 Company B: 11.0 9.8 9.9 10.2 10.1 9.7 11.0 11.1 10.2 9.6 (a) Calculate the sample mean and median for the data for the two companies. (b) Plot the data for the two companies on the same line and give your impression regarding any apparent differences between the two companies.For Exercise 1.6 on page 13, compute the sample standard deviation in tensile strength for the samples separately for the two temperatures. Does it appear as if an increase in temperature influences the variability in tensile strength? Explain. Reference Exercise 1.6: The tensile strength of silicone rubber is thought to be a function of curing temperature. A study was carried out in which samples of 12 specimens of the rubber were prepared using curing temperatures of 20 C and 45 C. The data below show the tensile strength values in megapascals. 20"C: 2.07 2.14 2.22 2.03 2.21 2.013 2.05 2.18 2.09 2.14 2.11 2.02 45"C: 2.52 2.15 2.49 2.03 2.37 2.05 2.42 2.08 2.42 2.20 2.01 (a) Show a dot plot of the data with both low and high temperature tensile strength values. (b) Compute sample mean tensile strength for both samples. (c) Does it appear as if curing temperature has an influence on tensile strength, based on the plot? Comment further. (d) Does anything else appear to be influenced by an increase in curing temperature? Explain.\f\f\fThe proportion of the budget for a certain type of industrial company that is allotted to environmental and pollution control is coming under scrutiny. A data collection project determines that the distribution of these proportions is given by f (v) = 10. 5(1-y)'. OSys1. elsewhere. (a) Verify that the above is a valid density function. (b) What is the probability that a company chosen at random expends less than 10% of its budget on environmental and pollution controls? (c) What is the probability that a company selected at random spends more than 50% of its budget on environmental and pollution controls?Exercise 1.3 on page 13 showed tensile strength data for two samples, one in which specimens were exposed to an aging process and one in which there was no aging of the specimens. (a) Calculate the sample variance as well as standard deviation in tensile strength for both samples. (b) Does there appear to be any evidence that aging affects the variability in tensile strength? (See also the plot for Exercise 1.3 on page 13.) Reference: Exercise 1.3: A certain polymer is used for evacuation systems for aircraft. It is important that the polymer be resistant to the aging process. Twenty specimens of the polymer were used in an experiment. Ten were assigned randomly to be exposed to an accelerated batch aging process that involved exposure to high temperatures for 10 days. Measurements of tensile strength of the specimens were made, and the following data were recorded on tensile strength in psi: No aging: 227 222 218 217 225 218 216 229 228 221 Aging: 219 214 215 211 209 218 203 204 201 205 (a) Do a dot plot of the data. (b) From your plot, does it appear as if the aging process has had an effect on the tensile strength of thispolymer? Explain. (c) Calculate the sample mean tensile strength of the two samples. (d) Calculate the median for both. Discuss the similarity or lack of similarity between the mean andmedian of each group
Step by Step Solution
There are 3 Steps involved in it

Get step-by-step solutions from verified subject matter experts