

Question: solve the question For the data of Exercise 1.4 on page 13, compute both the mean and the variance in flexibility for both company A
solve the question
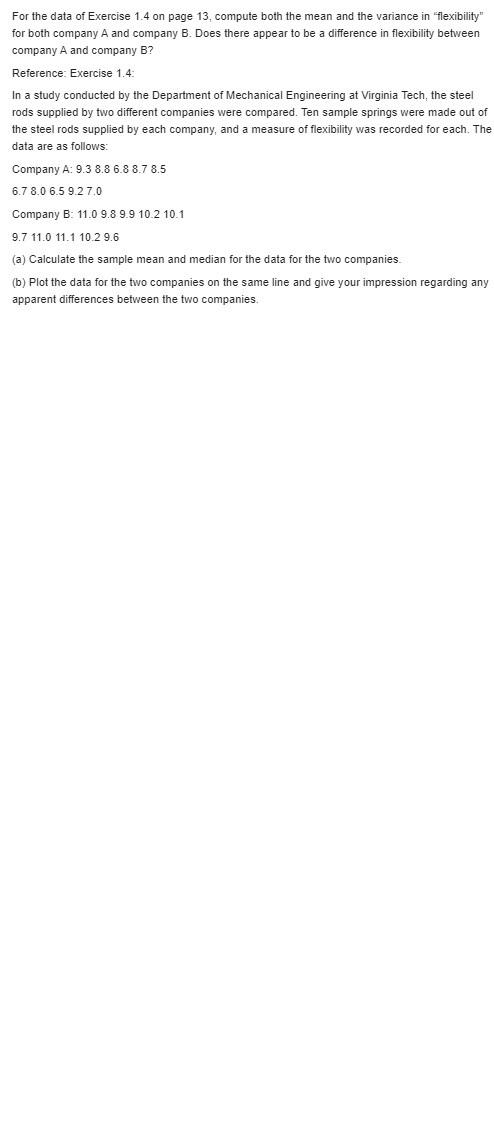
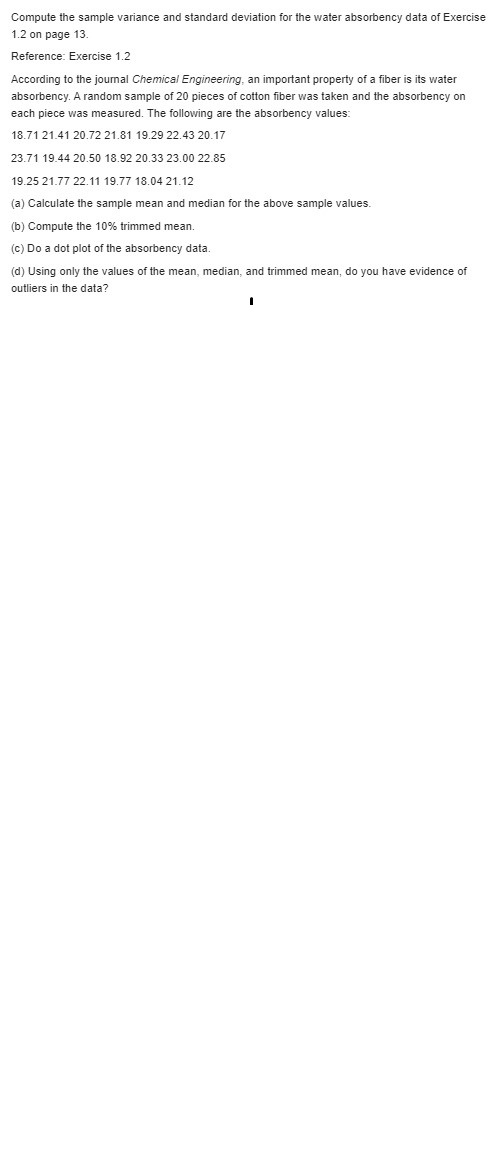
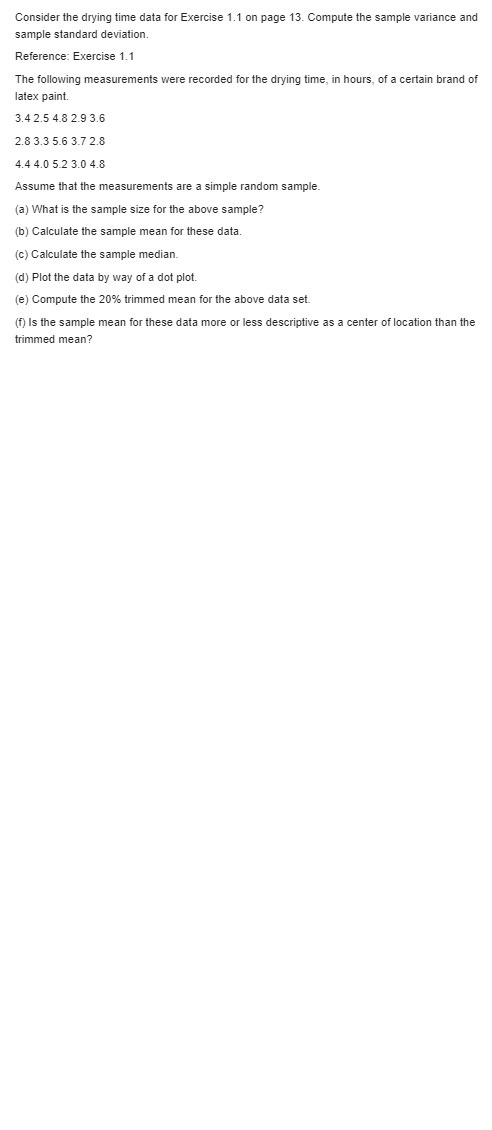
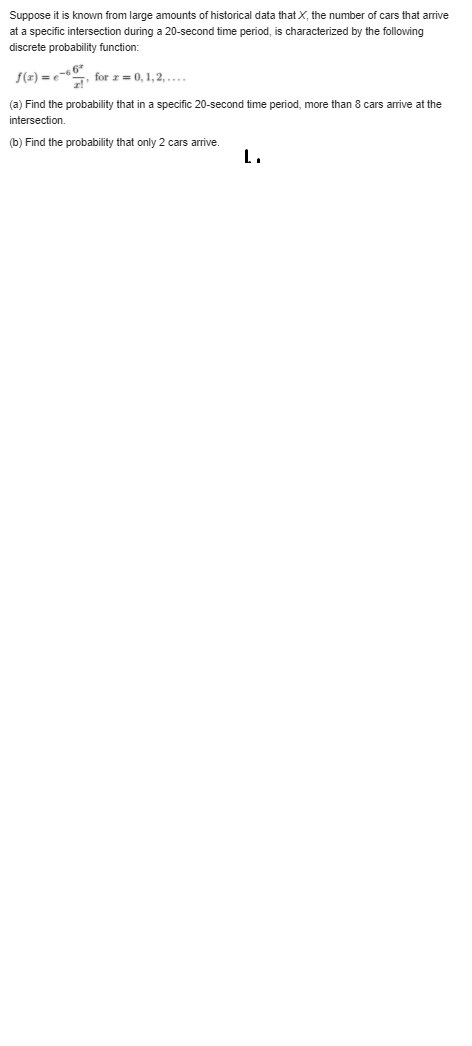
For the data of Exercise 1.4 on page 13, compute both the mean and the variance in "flexibility" for both company A and company B. Does there appear to be a difference in flexibility between company A and company B? Reference: Exercise 1.4: In a study conducted by the Department of Mechanical Engineering at Virginia Tech, the steel rods supplied by two different companies were compared. Ten sample springs were made out of the steel rods supplied by each company, and a measure of flexibility was recorded for each. The data are as follows: Company A: 9.3 8.8 6.8 8.7 8.5 6.7 8.0 6.5 9.27.0 Company B: 11.0 9.8 9.9 10.2 10.1 9.7 11.0 11.1 10.2 9.6 (a) Calculate the sample mean and median for the data for the two companies. (b) Plot the data for the two companies on the same line and give your impression regarding any apparent differences between the two companies.Compute the sample variance and standard deviation for the water absorbency data of Exercise 1.2 on page 13. Reference: Exercise 1.2 According to the journal Chemical Engineering, an important property of a fiber is its water absorbency. A random sample of 20 pieces of cotton fiber was taken and the absorbency on each piece was measured. The following are the absorbency values: 18.71 21.41 20.72 21.81 19.29 22.43 20.17 23.71 19.44 20.50 18.92 20.33 23.00 22.85 19.25 21.77 22.11 19.77 18.04 21.12 (a) Calculate the sample mean and median for the above sample values. (b) Compute the 10% trimmed mean. (c) Do a dot plot of the absorbency data. (d) Using only the values of the mean, median, and trimmed mean, do you have evidence of outliers in the data?Consider the drying time data for Exercise 1.1 on page 13. Compute the sample variance and sample standard deviation. Reference: Exercise 1.1 The following measurements were recorded for the drying tine. in hours. of a certain brand of latex pa'nt. 3.4 2.5 4.8 2.9 3.6 2.8 3.3 5.5 3.? 2.3 4.4 4.0 5.2 3.0 4.3 Assume that the measurements are a simple random sample. {a} What is the sample size for the above sample? {In} Calculate the sample mean for these data. {c} Calculate the sample median. {djl Plot the data by way of a dot plot. {e} Compute the 20% trirm'ned mean for the above data set. { Is the sample mean for these data more or less descriptive as a center of location than the trimmed mean? Suppose it is known from large amounts of historical data that X, the number of cars that arrive at a specific intersection during a 20-second time period, is characterized by the following discrete probability function: f(x) = e-65 7, for = = 0, 1,2, .... (a) Find the probability that in a specific 20-second time period, more than 8 cars arrive at the intersection. (b) Find the probability that only 2 cars arrive. L.\f
Step by Step Solution
There are 3 Steps involved in it

Get step-by-step solutions from verified subject matter experts