

Question: Need help in this please and thank you Question 2 (Essay Worth 10 points) (05.05 MC) the questions: A food truck did a daily survey
Need help in this please and thank you
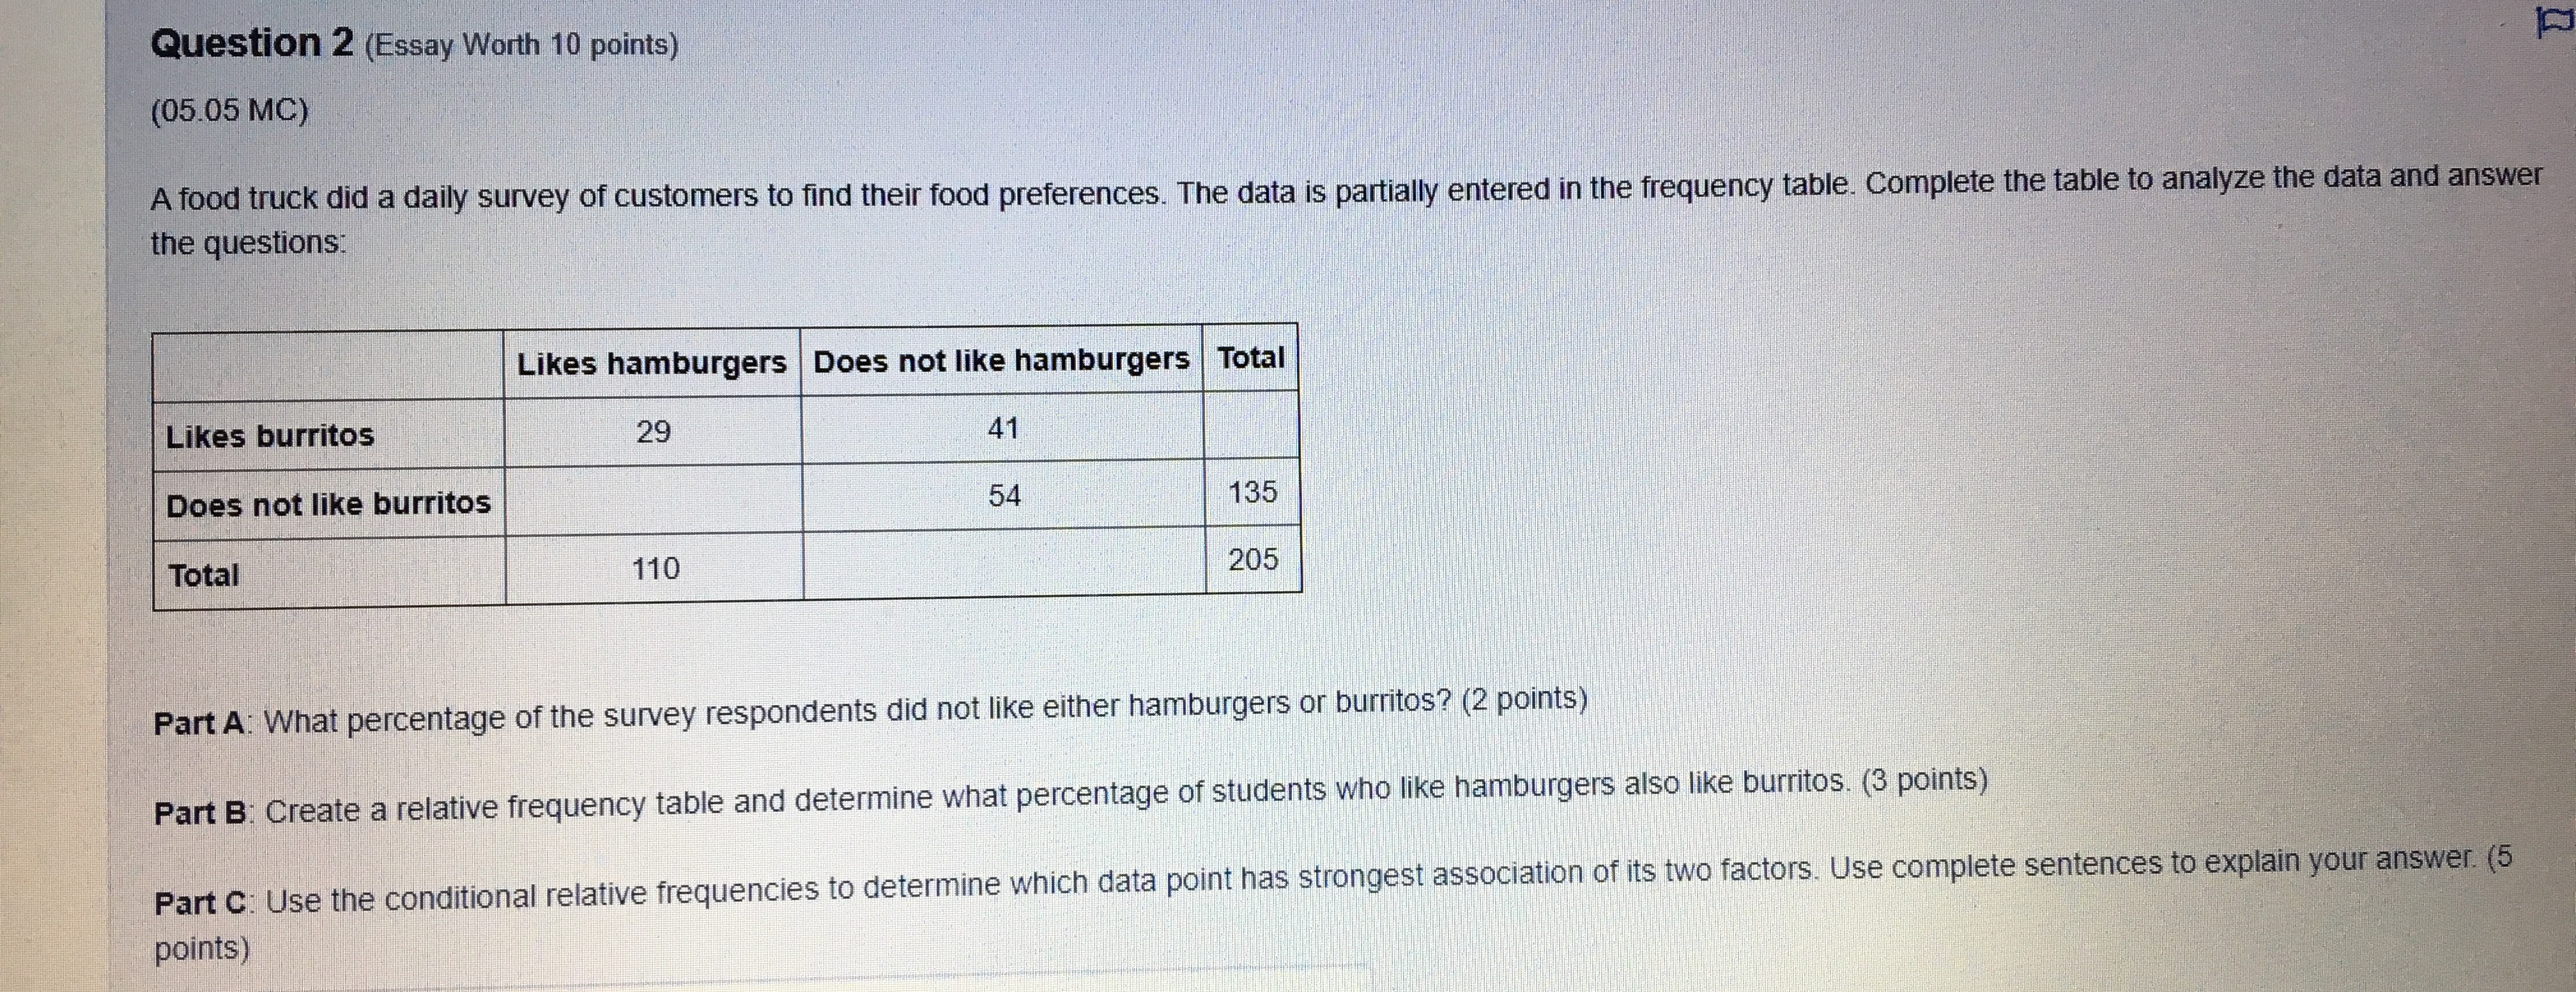
Question 2 (Essay Worth 10 points) (05.05 MC) the questions: A food truck did a daily survey of customers to find their food preferences. The data is partially entered in the frequency table. Complete the table to analyze the data and answer Likes hamburgers | Does not like hamburgers|Total Likes burritos 29 41 Does not like burritos 54 135 Total 110 205 Part A: What percentage of the survey respondents did not like either hamburgers or burritos? (2 points) Part B: Create a relative frequency table and determine what percentage of students who like hamburgers also like burritos. (3 points) Part C: Use the conditional relative frequencies to determine which data point has strongest association of its two factors. Use complete sentences to explain your answer. (5 points)
Step by Step Solution
There are 3 Steps involved in it

Get step-by-step solutions from verified subject matter experts