

Question: Need help on B) specifically the Standard Deviation part All work must be clearly shown for credit. T T Prices (in $1000) from a sample
Need help on B) specifically the "Standard Deviation" part
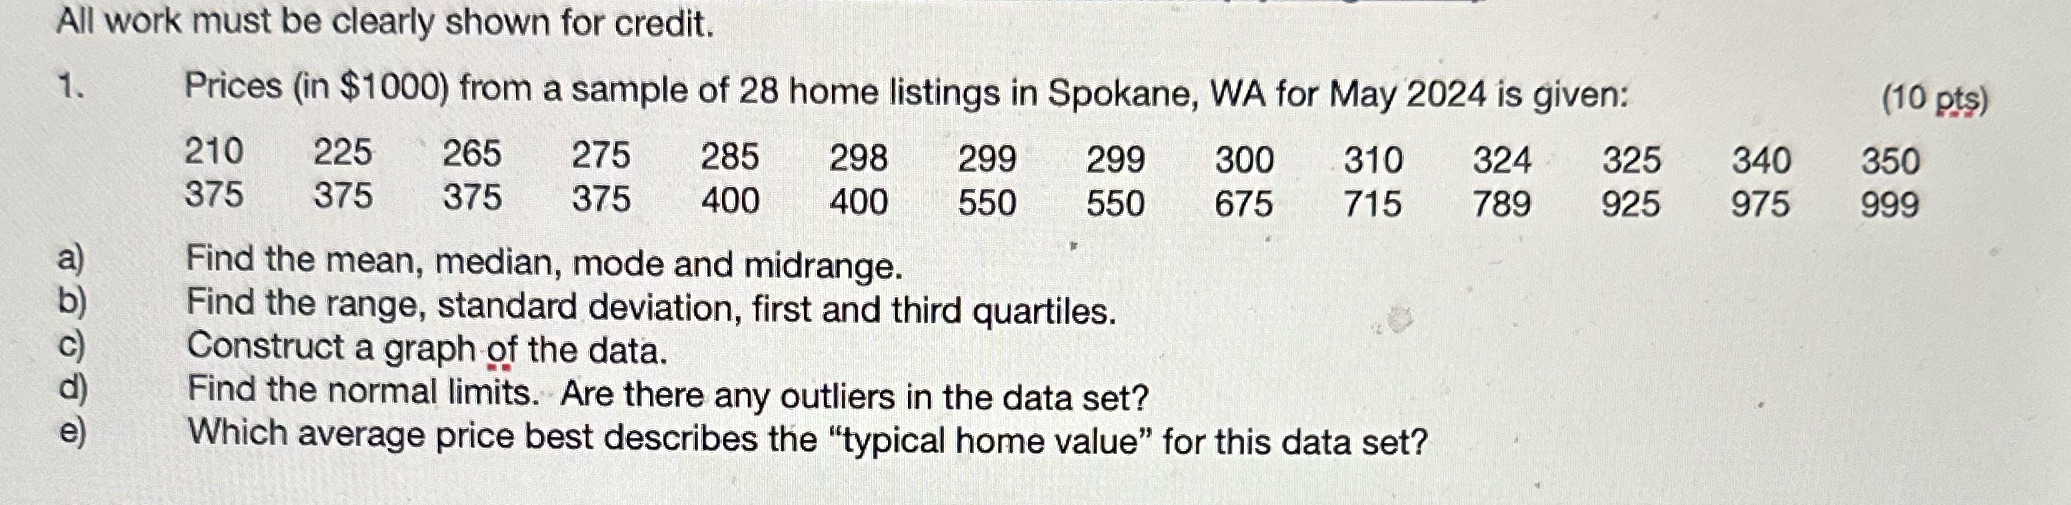
All work must be clearly shown for credit. T T Prices (in $1000) from a sample of 28 home listings in Spokane, WA for May 2024 is given: 210 225 265 275 285 298 299 299 300 310 324 325 340 375 375 375 375 400 400 550 550 675 715 789 925 975 Find the mean, median, mode and midrange. : Find the range, standard deviation, first and third quartiles. Construct a graph of the data. Find the normal limits. Are there any outliers in the data set? Which average price best describes the \"typical home value\" for this data set? (10 pts) 350 999
Step by Step Solution
There are 3 Steps involved in it
1 Expert Approved Answer
Step: 1 Unlock

Question Has Been Solved by an Expert!
Get step-by-step solutions from verified subject matter experts
Step: 2 Unlock
Step: 3 Unlock