

Question: Need help on creating a trend analysis. (horizontal and vertical analysis come from Nintendo) VerticalAnalvsis Millions in Dollars 2020 Percentage 2021 Percentage 2022 Percentage Net
Need help on creating a trend analysis. (horizontal and vertical analysis come from Nintendo)
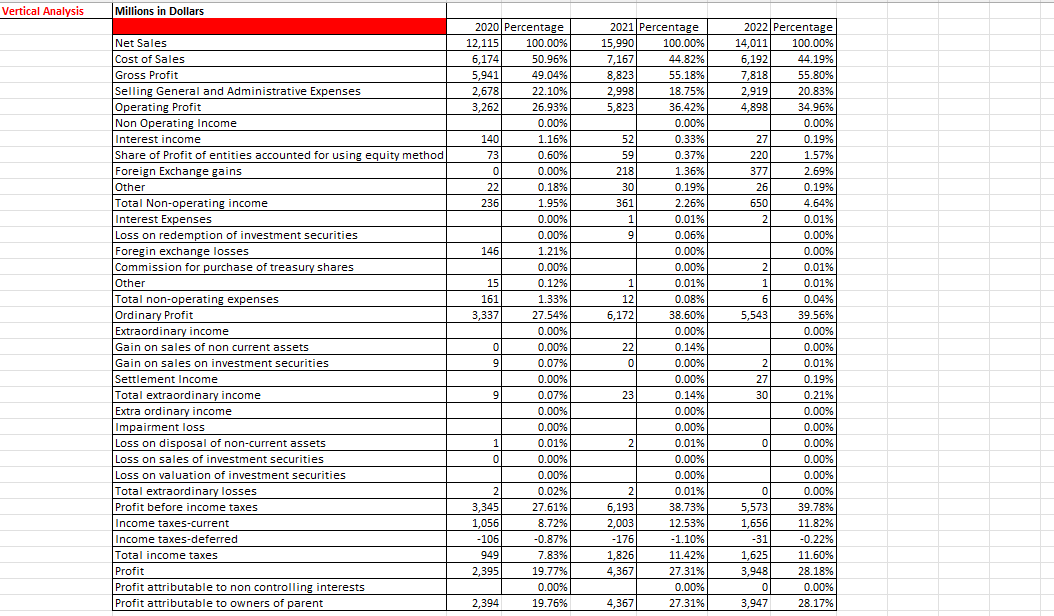
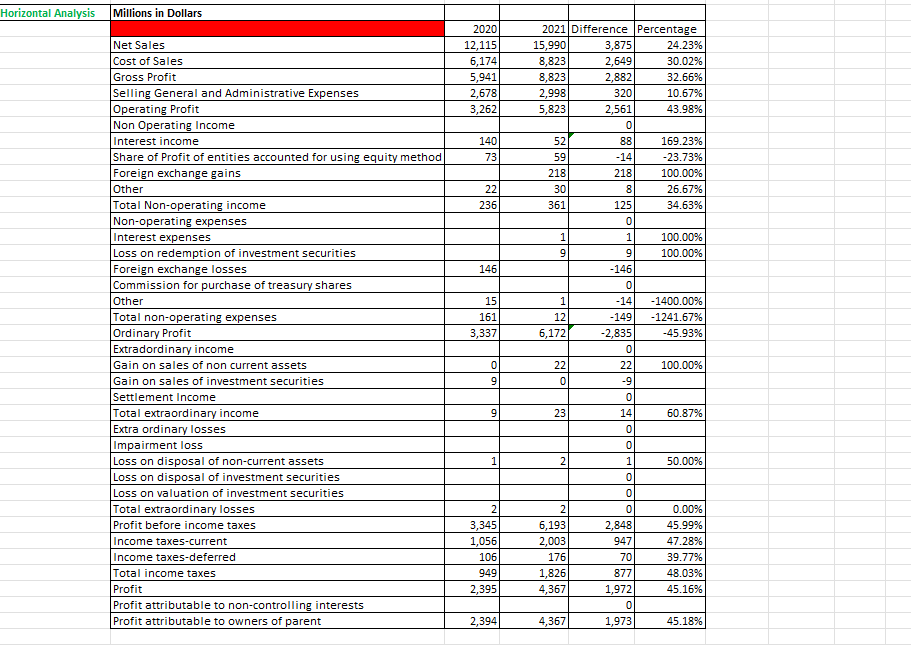
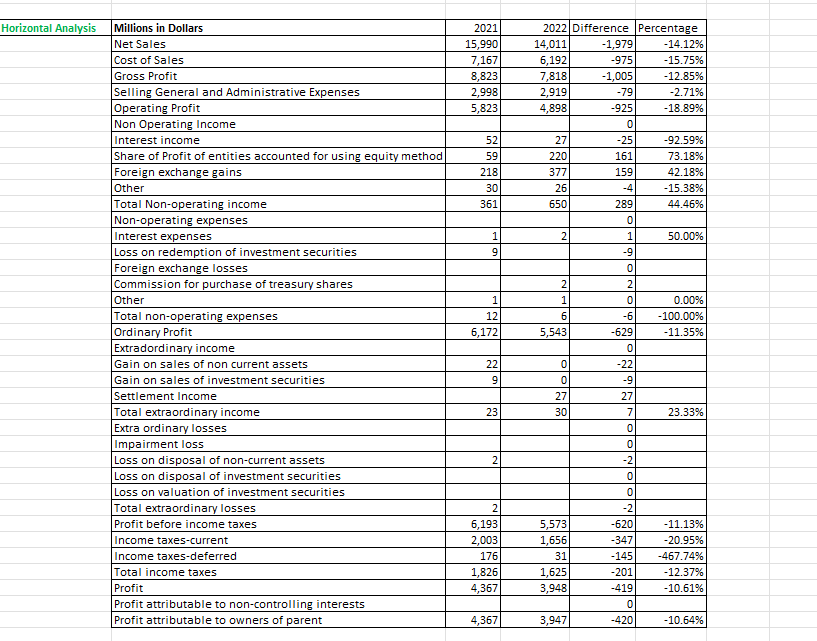
VerticalAnalvsis Millions in Dollars 2020 Percentage 2021 Percentage 2022 Percentage Net Sales 12,115 100.00% 15,990 100.00% 14,011 100.00% Cost of Sales 5,124 50.95% 2,152 44.32% 5,192 44.19% Gross Profit 5,941 49.04% 3,323 55.13% 2,313 55.30% Selling General and Administrative Expenses 2,523 22.10% 2,993 13.25% 2,919 20.33% Operating Profit 3,252 25.93% 5,323 35.42% 4,393 34.95% Non Operating Income 0.00% 0.00% 0.00% Interest income 140 1.15% 52 0.33% 22 0.19% Share of Profit of entities accounted for using equity.I method 23 0.50% 59 0.32% 220 1.52% Foreign Exchange gains 0 0.00% 213 1.35% 322 2.59% Other 22 0.13% 30 0.19% 25 0.19% Total Non-operating income 235 1.95% 351 2.25% 550 4.54% Interest Expenses 0.00% 1 0.01% 2 0.01% Loss on redemption of investment securities 0.00% 9 0.05% 0.00% Foregin exchange losses 145 1.21% 0.00% 0.00% Commission for purchase oftreasurhlI shares 0.00% 0.00% 2 0.01% Other 15 0.12% 1 0.01% 1 0.01% Total non-operating expenses 151 1.33% 12 0.03% 5 0.04% Ordinarv Profit 3,332 22.54% 5,122 33.50% 5,543 39.55% Extraordinary.I income 0.00% 0.00% 0.00% Gain on sales of non current assets 0 0.00% 22 0.14% 0.00% Gain on sales on investment securities 9 0.02% 0 0.00% 2 0.01% Settlement Income 0.00% 0.00% 22 0.19% Total extraordinary.I income 9 0.02% 23 0.14% 30 0.21% Extra ordinary.I income 0.00% 0.00% 0.00% Impairment loss 0.00% 0.00% 0.00% Loss on disposal of non-current assets 1 0.01% 2 0.01% 0 0.00% Loss on sales of investment securities 0 0.00% 0.00% 0.00% Loss on valuation of investment securities 0.00% 0.00% 0.00% Total extraordinary.I losses 2 0.02% 2 0.01% 0 0.00% Profit before income taxes 3,345 22.51% 5,193 33.23% 5,523 39.23% Income taxes-current 1,055 3.22% 2,003 12.53% 1,555 11.32% Income taxes-deferred -105 -0.32% -125 -1.10% -31 -0.22% Total income taxes 949 2.33% 1,325 11.42% 1,525 11.50% Profit 2,395 19.22% 4,352 22.31% 3,943 23.13% Profit attributable to non controlling interests 0.00% 0.00% 0 0.00% Profit attributable to owners of parent 2,394 19.25% 4,352 22.31% 3,942 23.12% Horizontal Analysis Millions in Dollars 2020 2021 Difference |Percentage Net Sales 12,115 15,990 3,875 24.23% Cost of Sales 6,174 8,823 2,649 30.02% Gross Profit 5,941 8,823 2,882 32.66% Selling General and Administrative Expenses 2,678 2,998 320 10.67% Operating Profit 3,262 5,823 2,561 13.98% Non Operating Income 0 Interest income 140 52 88 169.23% Share of Profit of entities accounted for using equity method 73 59 -14 -23.73% Foreign exchange gains 218 218 100.00% Other 22 30 8 26.67% Total Non-operating income 236 361 125 34.63% Non-operating expenses 0 Interest expenses 1 1 100.00% Loss on redemption of investment securities 9 100.00% Foreign exchange losses 146 -146 Commission for purchase of treasury shares 0 Other 15 -14 1400.00% Total non-operating expenses 161 12 149 -1241.67% Ordinary Profit 3,337 6,172 -2,835 -45.93% Extradordinary income 0 Gain on sales of non current assets 22 22 100.00% Gain on sales of investment securities 9 -9 Settlement Income Total extraordinary income LD 23 14 60.87% Extra ordinary losses Impairment loss Loss on disposal of non-current assets 1 2/ 50.00% Loss on disposal of investment securities Loss on valuation of investment securities Total extraordinary losses 2 2 0 0.00% Profit before income taxes 3,345 6,193 2,848 45.99% Income taxes-current 1,056 2,003 947 47.28% Income taxes-deferred 106 176 70 39.77% Total income taxes 349 1,826 377 48.03% Profit 2,395 4,367 1,972 45.16% Profit attributable to non-controlling interests 0 Profit attributable to owners of parent 2,394 4,367 1,973 45.18%Horizontal Analysis Millions in Dollars 2021 2022 Difference |Percentage Net Sales 15,990 14,011 1,979 14.12% Cost of Sales 7,167 5,192 975 -15.75% Gross Profit 3,823 7,818 -1,005 12.85% Selling General and Administrative Expenses 2,998 2,919 -79 2.71% Operating Profit 5,823 4,898 925 18.89% Non Operating Income 0 Interest income 52 27 -25 92.59% Share of Profit of entities accounted for using equity method 59 220 161 73.18% Foreign exchange gains 218 377 159 42.18% Other 30 26 -4 15.38% Total Non-operating income 361 50 44.46% Non-operating expenses 0 Interest expenses 1 2 50.00% Loss on redemption of investment securities -9 Foreign exchange losses Commission for purchase of treasury shares Other 1 0.00% Total non-operating expenses 12 -6 -100.00% Ordinary Profit 6,172 5.543 -629 -11.35% Extradordinary income Gain on sales of non current assets 22 -22 Gain on sales of investment securities Settlement Income Total extraordinary income 23 30 23.33% Extra ordinary losses Impairment loss Loss on disposal of non-current assets 2 -2 Loss on disposal of investment securities Loss on valuation of investment securities Total extraordinary losses 2 -2 Profit before income taxes 5,193 5,573 620 -11.13% Income taxes-current 2,003 1,656 -347 20.95% Income taxes-deferred 176 31 145 -467.74% Total income taxes 1,826 1,625 201 -12.37% Profit 4,367 3,948 -419 10.61% Profit attributable to non-controlling interests Profit attributable to owners of parent 4,367 3,947 420 -10.64%
Step by Step Solution
There are 3 Steps involved in it

Get step-by-step solutions from verified subject matter experts