

Question: Need help on getting A) B) C) Accounting 4B a Which of the following graphs illustrates how TOTAL variable costs behave with changes in total
Need help on getting A) B) C)
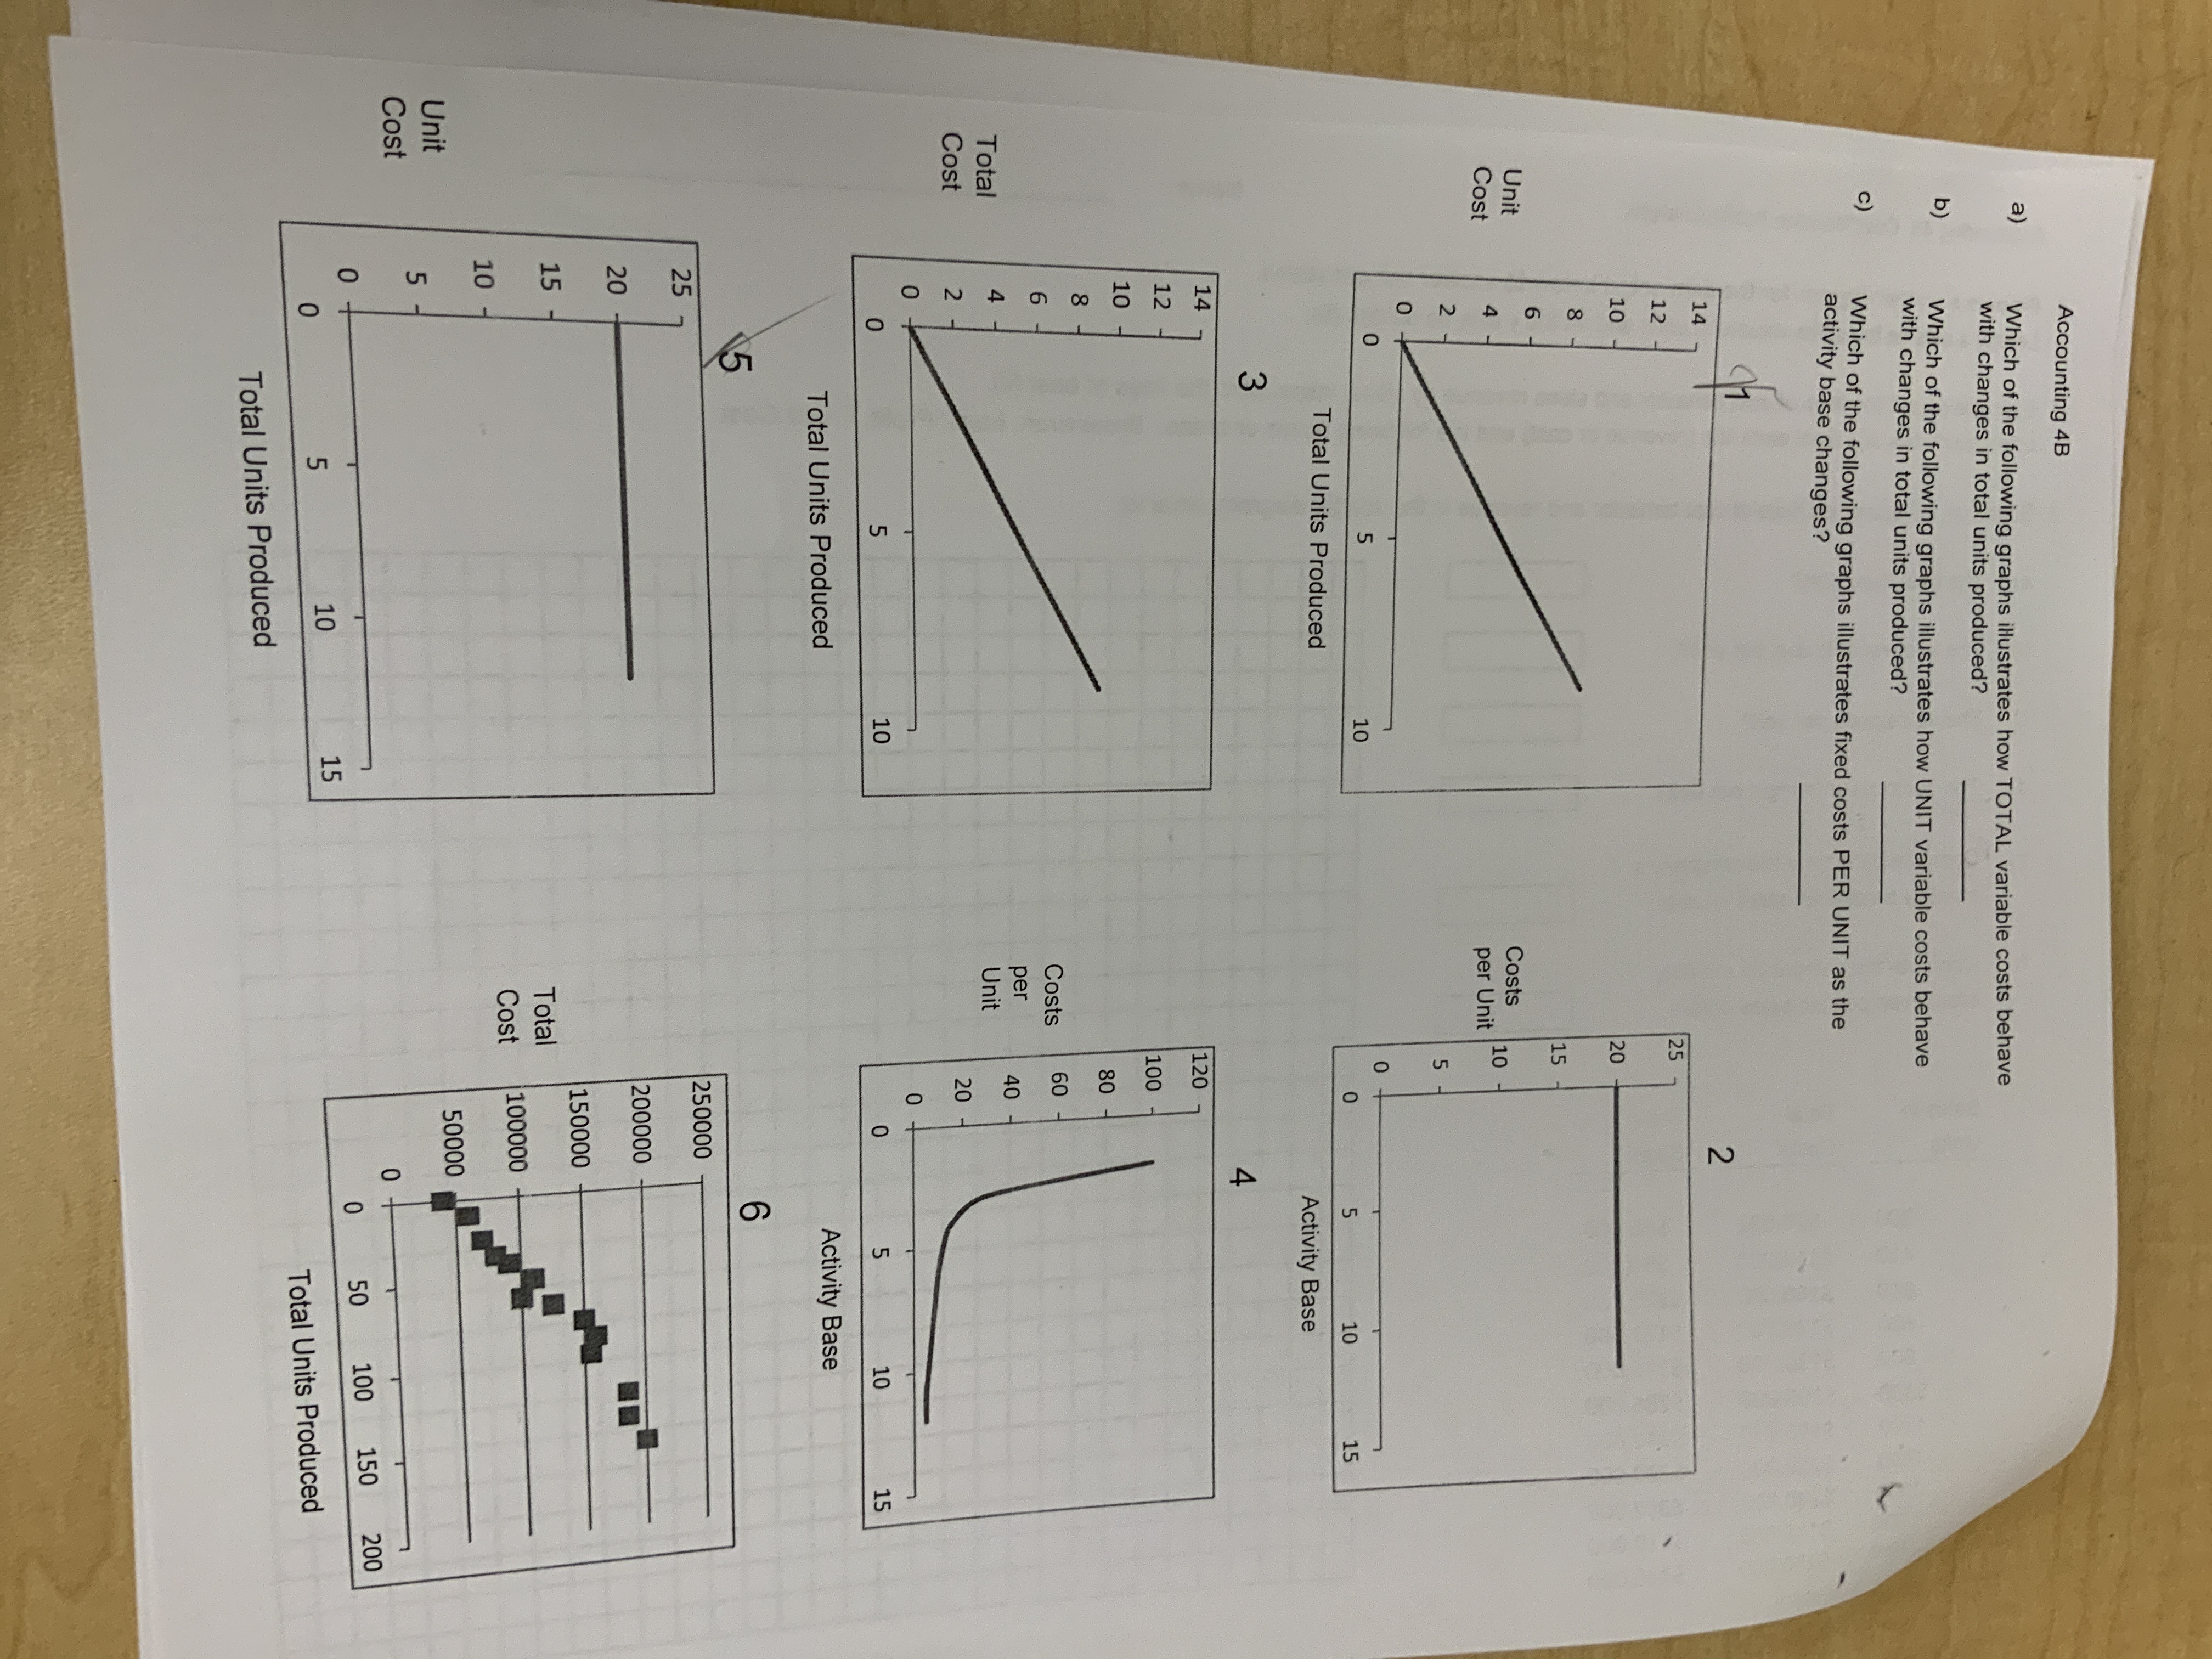
Accounting 4B a Which of the following graphs illustrates how TOTAL variable costs behave with changes in total units produced? b) Which of the following graphs illustrates how UNIT variable costs behave with changes in total units produced? C) Which of the following graphs illustrates fixed costs PER UNIT as the activity base changes? 2 14 12 25 10 20 15 Unit Cost ND Costs per Unit 10 5 O 10 0 5 10 15 Total Units Produced Activity Base 3 4 14 120 12 100 10 ONDOO 80 Costs 60 per 40 Total Unit Cost 20 0 5 10 0 5 10 15 Total Units Produced Activity Base 5 6 25 250000 200000 20 150000 15 Tota Cost 100000 10 Unit 50000 5 Cost 15 0 50 100 150 200 5 10 Total Units Produced Total Units Produced
Step by Step Solution
There are 3 Steps involved in it

Get step-by-step solutions from verified subject matter experts