

Question: need help on how to do these in excel please thanks. The table below lists the prices (in thousands) of used cars sold and the
need help on how to do these in excel please thanks.
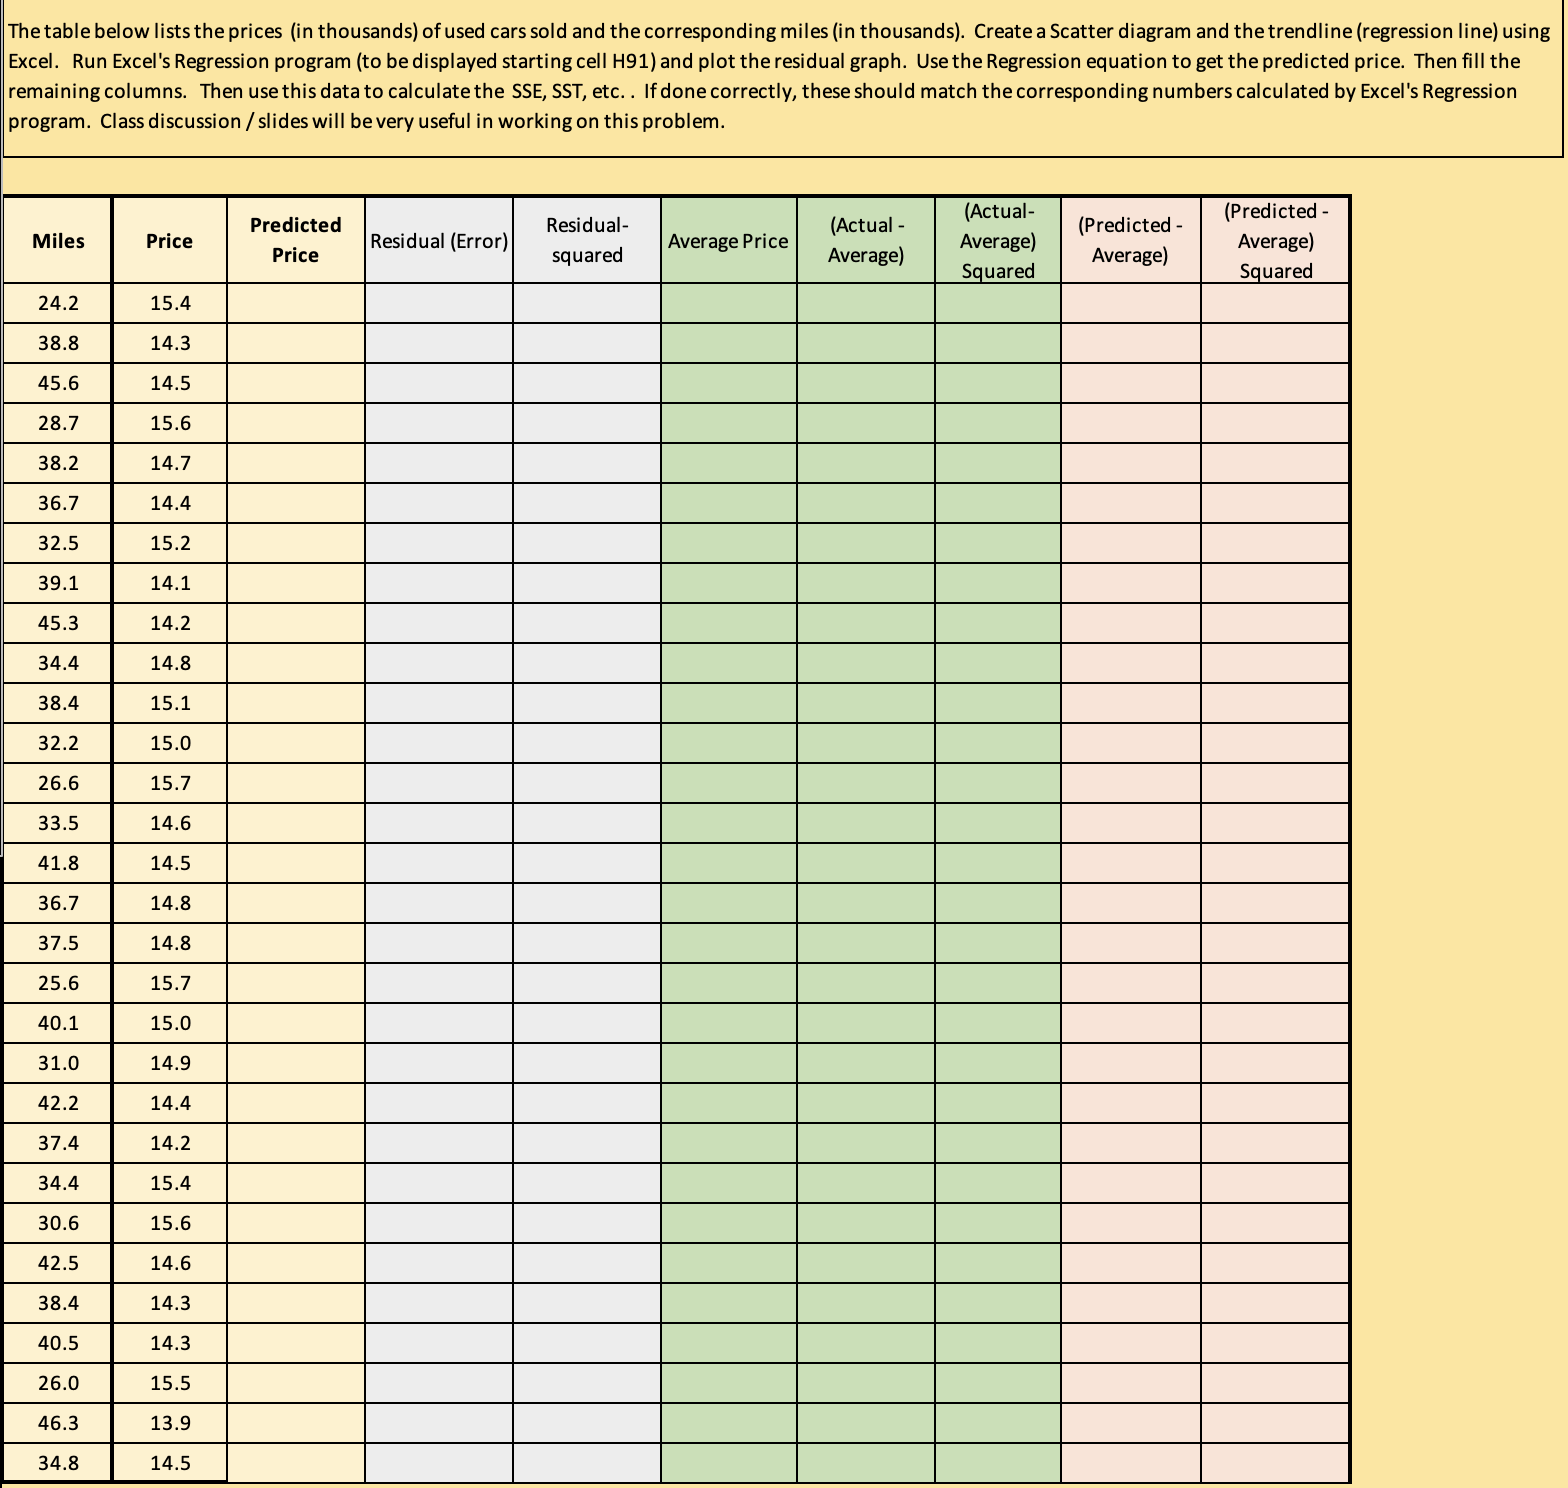
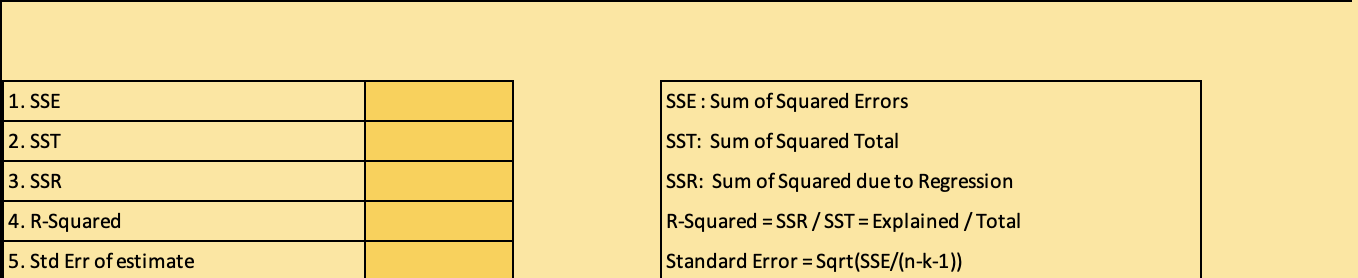
The table below lists the prices (in thousands) of used cars sold and the corresponding miles (in thousands). Create a Scatter diagram and the trendline (regression line) using Excel. Run Excel's Regression program (to be displayed starting cell H91) and plot the residual graph. Use the Regression equation to get the predicted price. Then fill the remaining columns. Then use this data to calculate the SSE, SST, etc. . If done correctly, these should match the corresponding numbers calculated by Excel's Regression program. Class discussion / slides will be very useful in working on this problem. Predicted Miles Residual- (Actual- (Predicted - Predicted Price Residual (Error) (Actual Price squared Average Price Average) Average) Average) Average) Squared Squared 24.2 15.4 38.8 14.3 45.6 4.5 28.7 15.6 38.2 14.7 36.7 14.4 32.5 15.2 39.1 14.1 15.3 14.2 4.4 14.8 38.4 15.1 32.2 15.0 26.6 15.7 33.5 14.6 41.8 14.5 36.7 14.8 37.5 14.8 25.6 15.7 40.1 15.0 1.0 14.9 42.2 14.4 37.4 14.2 34.4 15.4 30.6 15.6 12.5 14.6 38.4 14.3 10.5 14.3 26.0 15.5 46.3 13.9 34 8 14.51. SSE SSE : Sum of Squared Errors 2. SST SST: Sum of Squared Total 3. SSR SSR: Sum of Squared due to Regression 4. R-Squared R-Squared = SSR / SST = Explained / Total 5. Std Err of estimate Standard Error = Sqrt(SSE/(n-k-1))
Step by Step Solution
There are 3 Steps involved in it

Get step-by-step solutions from verified subject matter experts