

Question: Need Help on matlab!!! zombies.pdf is When Zombies Attack! by Munz et all can search at google simply. I did number one and I need
Need Help on matlab!!!
zombies.pdf is When Zombies Attack! by Munz et all
can search at google simply.
I did number one and I need help on number two.
This is my code for number 1.
For basic model, substituting values for each parameter as given below. Fate of humanity after 20 weeks is shown in output.
a=0.005;
b=0.0095;
ze=0.0001;
d=0.0001;
T=20*7;
dt=1;
% This function will solve the system of ODEs for the basic model used in
% the Zombie Dynamics project for MAT 5187. It will then plot the curve of
% the zombie population based on time.
% Function Inputs: a - alpha value in model: "zombie destruction" rate
% b - beta value in model: "new zombie" rate
%When Zombies Attack! 147
% ze - zeta value in model: zombie resurrection rate
% d - delta value in model: background death rate
% T - Stopping time
% dt - time step for numerical solutions
% Created by Philip Munz, November 12, 2008
%Initial set up of solution vectors and an initial condition
N = 500; %N is the population
n = T/dt;
t = zeros(1,n+1);
s = zeros(1,n+1);
z = zeros(1,n+1);
r = zeros(1,n+1);
s(1) = N;
z(1) = 0;
r(1) = 0;
t = 0:dt:T;
% Define the ODEs of the model and solve numerically by Eulers method:
for i = 1:n
s(i+1) = s(i) + dt*(-b*s(i)*z(i)); %here we assume birth rate
%= background deathrate, so only term is -b term
z(i+1) = z(i) + dt*(b*s(i)*z(i) -a*s(i)*z(i) +ze*r(i));
r(i+1) = r(i) + dt*(a*s(i)*z(i) +d*s(i) - ze*r(i));
if s(i)N
break
end
if z(i) > N || z(i)
break
end
if r(i) N
break
end
end
hold on
plot(t,s,'b');
plot(t,z,'r');
legend('Suscepties','Zombies')
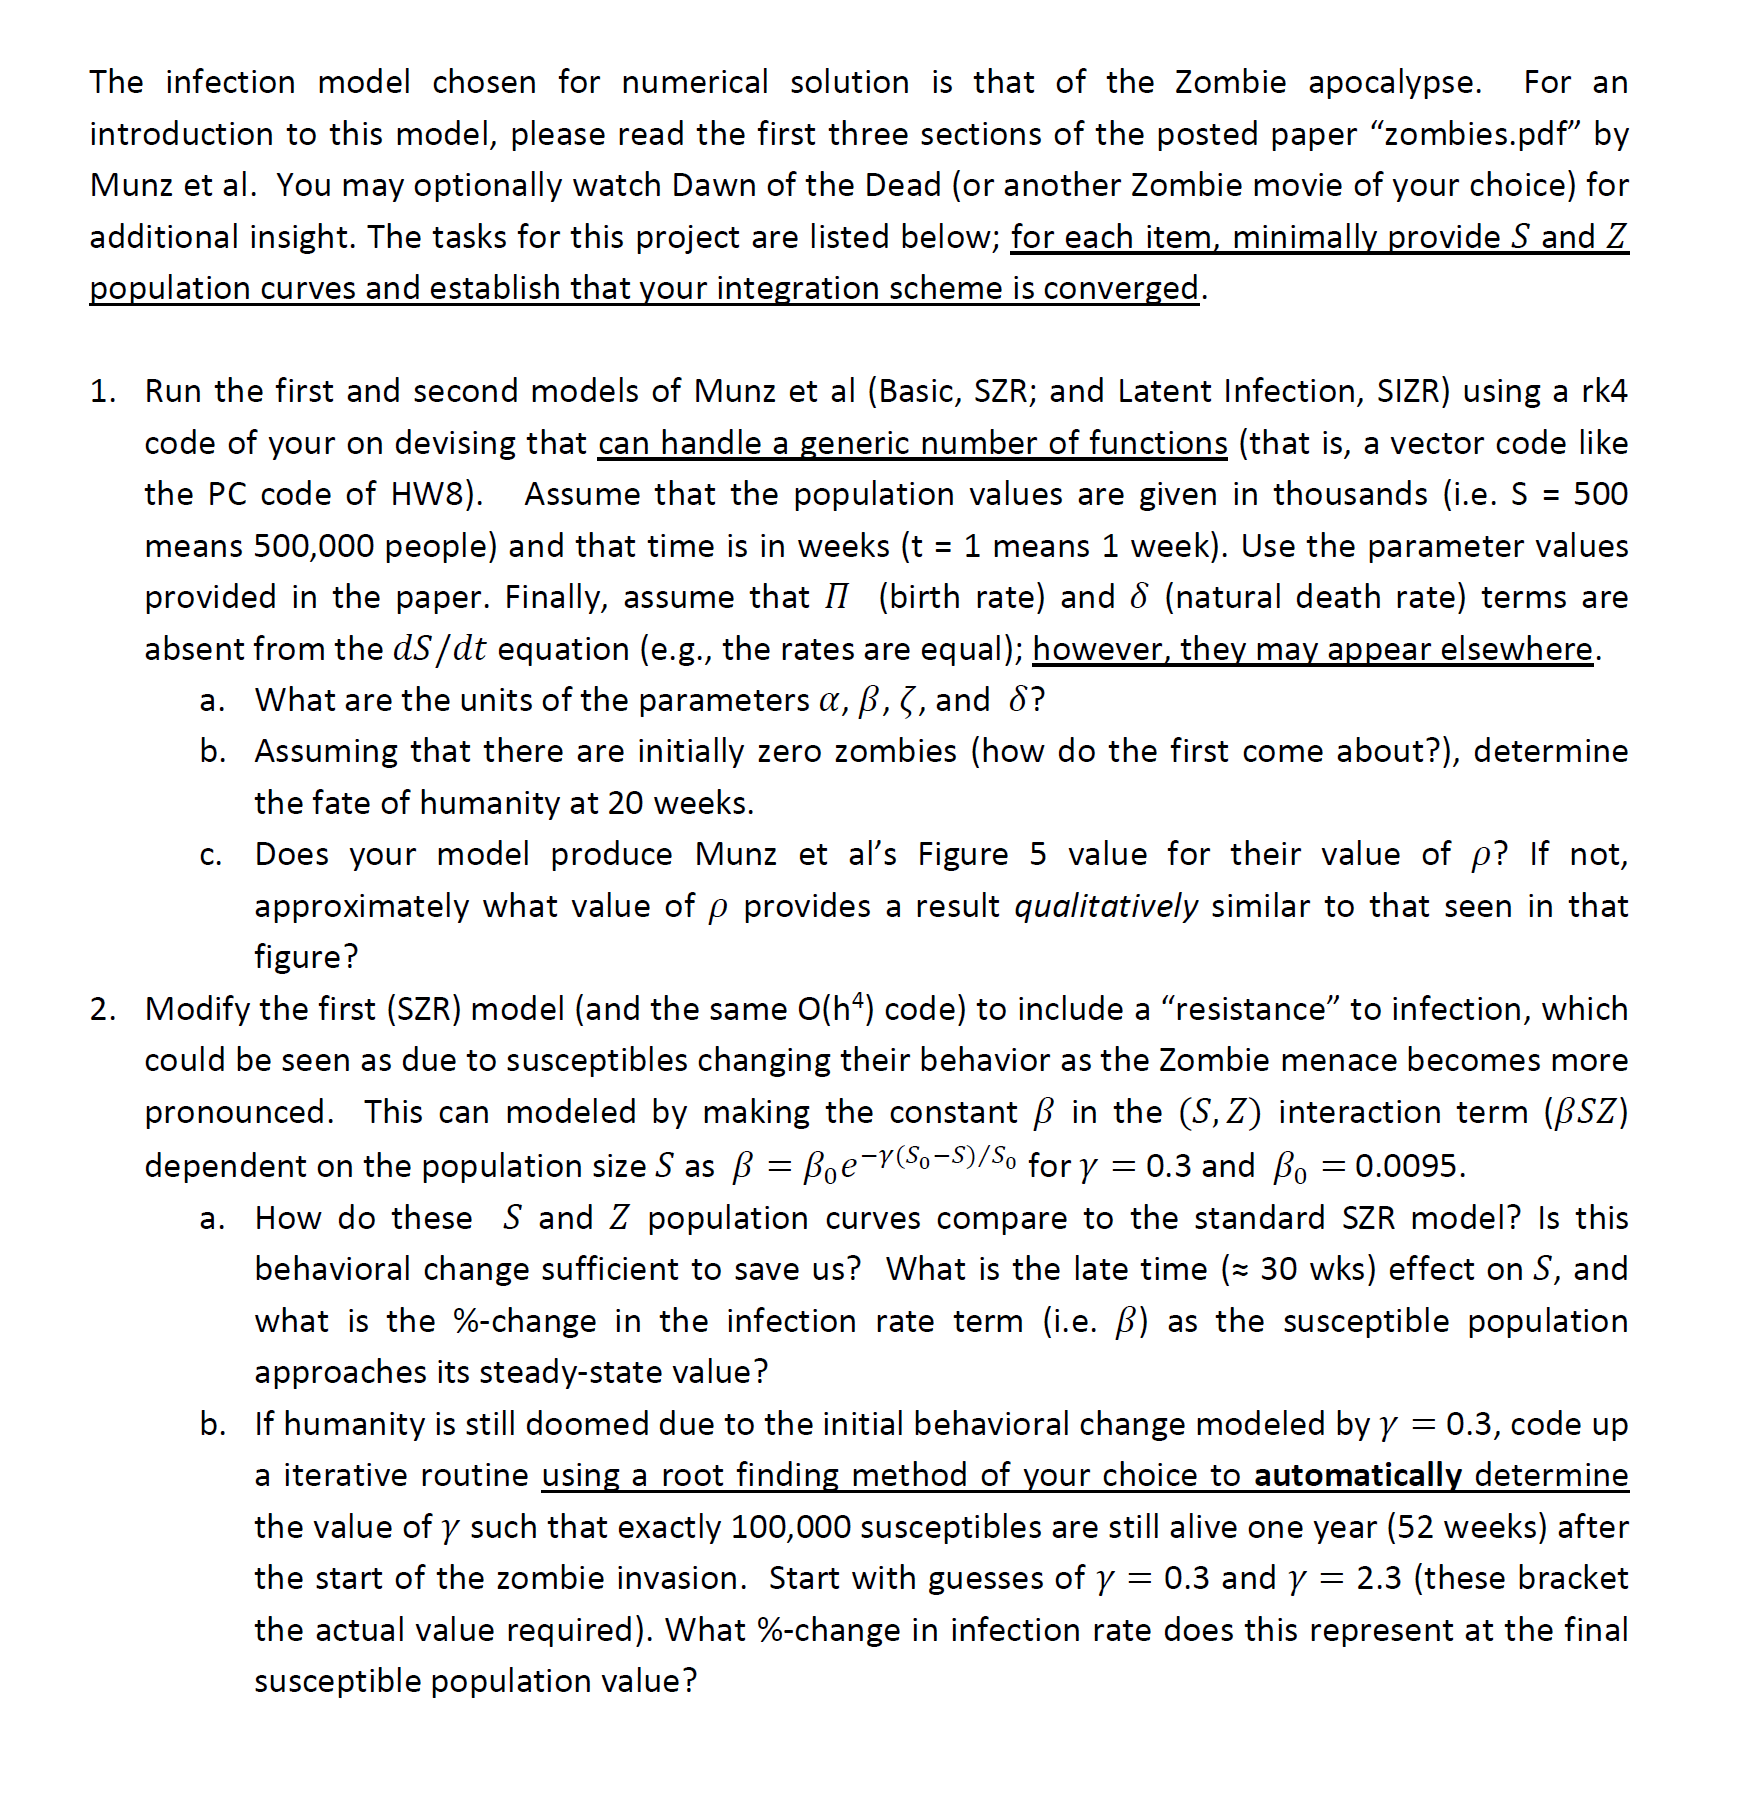
The infection model chosen for numerical solution is that of the Zombie apocalypse. For an introduction to this model, please read the first three sections of the posted paper "zombies.pdf" by Munz et al. You may optionally watch Dawn of the Dead (or another Zombie movie of your choice) for additional insight. The tasks for this project are listed below: for each item, minimally provide S and Z opulation curves and establish that vour integration scheme is converged 1. Run the first and second models of Munz et al (Basic, SZR; and Latent Infection, SIZR) using a rk4 code of your on devising that can handle a generic number of functions (that is, a vector code like the PC code of HW8). Assume that the population values are given in thousands (ie, S = 500 means 500,000 people) and that time is in weeks (t = 1 means 1 week). Use the parameter values provided in the paper. Finally, assume that (birth rate) and (natural death rate) terms are absent from the dS/dt equation (e.g., the rates are equal); however,they may appear elsewhere What are the units of the parameters , , , and ? b. Assuming that there are initially zero zombies (how do the first come about?), determine the fate of humanity at 20 weeks C. Does your model produce Munz et al's Figure 5 value for their value of ? If not approximately what value of provides a result qualitatively similar to that seen in that gure Modify the first (SZR) model (and the same O(h4) code) to include a "resistance" to infection, which could be seen as due to susceptibles changing their behavior as the Zombie menace becomes more pronounced. This can modeled by making the constant in the (S,Z) interaction term (PSZ) 2. dependent on the population size S as -Boe-v y(So-S) /So 0 for 0.3 and 0-0.0095 a. How do these S and Z population curves compare to the standard SZR model? Is this behavioral change sufficient to save us? What is the late time 30 wks) effect on S, and what is the %-change in the infection rate term (ie. ) as the susceptible population approaches its steady-state value? b. If humanity is still doomed due to the initial behavioral change modeled by y - 0.3, code up a iterative routine using a root finding method of vour choice to automaticallv determine the value of such that exactly 100,000 susceptibles are still alive one year (52 weeks) after 2.3 (these bracket the actual value required). What %-change in infection rate does this represent at the final the start of the zombie invasion. Start with guesses of - 0.3 and susceptible population value
Step by Step Solution
There are 3 Steps involved in it

Get step-by-step solutions from verified subject matter experts