

Question: need help on question c Check my work View The table shows the annual compensation of 40 randomly chosen CEOs (millions of dollars). 5.33 18.3
need help on question c
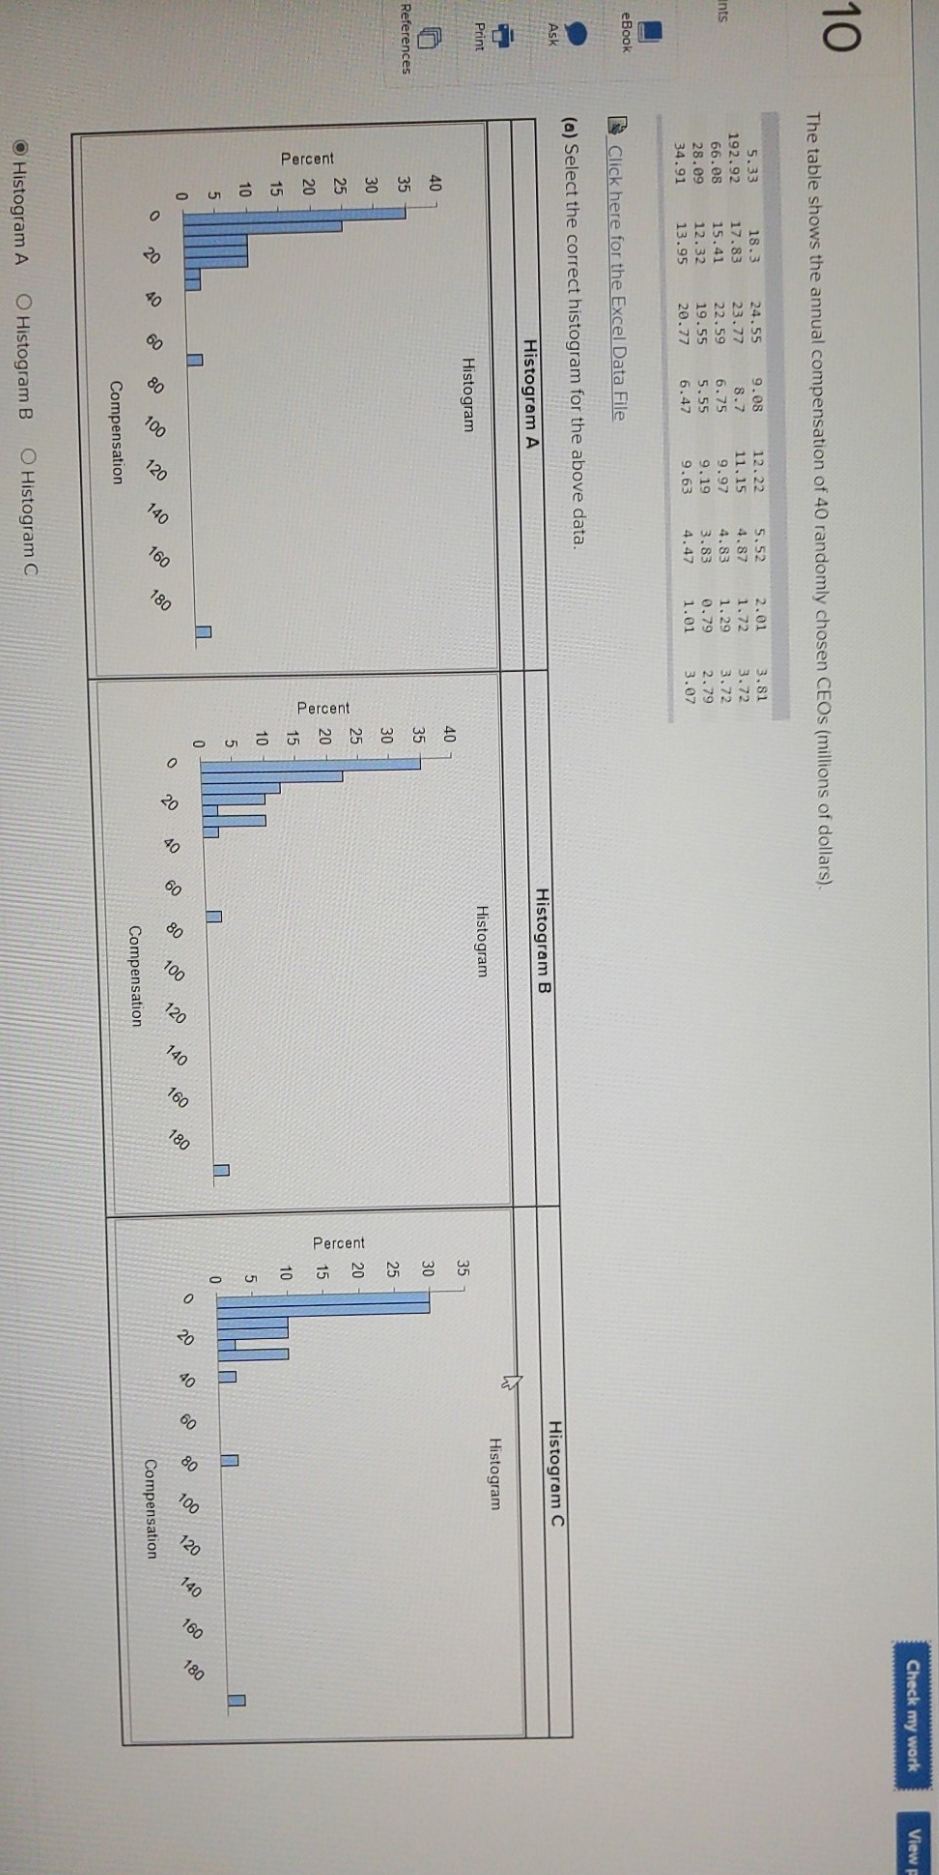
Check my work View The table shows the annual compensation of 40 randomly chosen CEOs (millions of dollars). 5.33 18.3 9.08 nts 192.92 17.83 24.55 12.22 23.77 5.52 8.7 11. 15 4.87 2.01 3.81 66.08 15.41 22.59 1.72 5.75 9.97 3.72 4.83 28. 09 12.32 19.55 1.29 5.55 9. 19 3.72 34.91 0.79 13.95 3.83 20.77 6.47 9.63 2.79 4.47 1.01 3.07 eBook Click here for the Excel Data File Ask (a) Select the correct histogram for the above data. Histogram A Histogram B Histogram C Print Histogram Histogram Histogram References Percent Percent Percent 8 8 8 8 2 O O VOL 120 Obi 091 180 O 120 OPL 091 180 O OOL 120 091 180 Compensation Compensation Compensation Histogram A O Histogram B O Histogram C
Step by Step Solution
There are 3 Steps involved in it

Get step-by-step solutions from verified subject matter experts