

Question: 1 20 points eBook References Section Exercise 3-8 (Static) The table shows the annual compensation of 40 randomly chosen CEOs (millions of dollars). 5.33 192.92
1 20 points eBook References Section Exercise 3-8 (Static) The table shows the annual compensation of 40 randomly chosen CEOs (millions of dollars). 5.33 192.92 24.55 23.77 9.08 8.7 12.22 11.15 66.08 22.59 6.75 9.97 28.09 19.55 5.55 9.19 34.91 20.77. 6.47 9.63 Percent Click here for the Excel Data File (a) Select the correct histogram for the above data. Histogram A Histogram 40 35 30 15 10 5 18.3 17.83 15.41 12.32 13.95 0 5.52 4.87 4.83 3.83 4.47 2.01 1.72 1.29 0.79 1.01 3.81 3.72 3.72 2.79 3.07 Percent 40 35 30 25 20 15 10 5 0 Histogram B Histogram
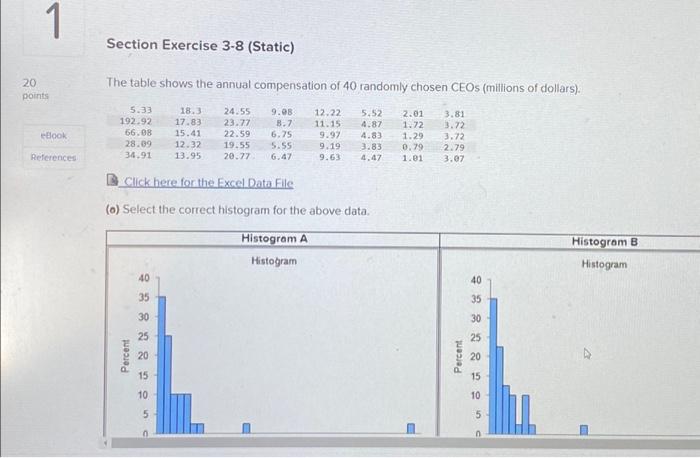
Section Exercise 38 (Static) The table shows the annual compensation of 40 randomly chosen CEOs (millions of dollars). Click here for the Excel Data File (o) Select the correct histogram for the above data. Section Exercise 38 (Static) The table shows the annual compensation of 40 randomly chosen CEOs (millions of dollars). Click here for the Excel Data File (o) Select the correct histogram for the above data
Step by Step Solution
There are 3 Steps involved in it
1 Expert Approved Answer
Step: 1 Unlock

Question Has Been Solved by an Expert!
Get step-by-step solutions from verified subject matter experts
Step: 2 Unlock
Step: 3 Unlock