

Question: Need help on the last 4 tasks (please include excel formulas). 11 6 12 6 In cell 127, use the FORECAST LINEAR function (or the
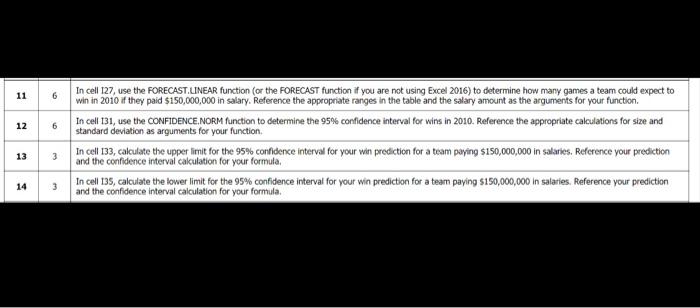
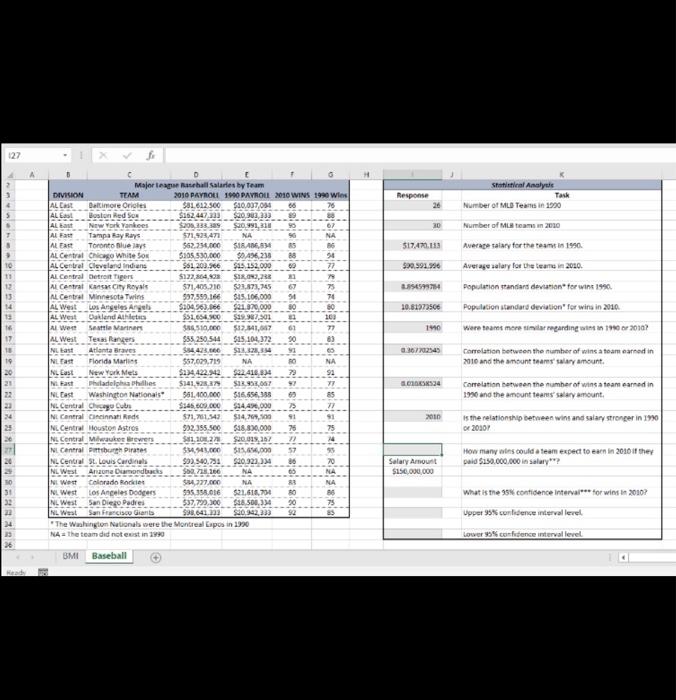
11 6 12 6 In cell 127, use the FORECAST LINEAR function (or the FORECAST function if you are not using Excel 2016) to determine how many games a team could expect to win in 2010 if they paid $150,000,000 in salary. Reference the appropriate ranges in the table and the salary amount as the arguments for your function. In cell 131, use the CONFIDENCE.NORM function to determine the 95% confidence interval for wins in 2010. Reference the appropriate calculations for size and standard deviation as arguments for your function, In cell 133, calculate the upper limit for the 95% confidence interval for your win prediction for a team paying $150,000,000 in salaries. Reference your prediction and the confidence interval calculation for your formula In cell 135, calculate the lower limit for the 95% confidence interval for your win prediction for a team paying $150,000,000 in salaries. Reference your prediction and the confidence interval calculation for your formula. 13 3 14 127 " . Statistical Analyse Response 4 5 AL 30 51747. Number of MLB Tears in 1990 Number of leta 2000 Average salary for the team in 1990 Average salary for the team in 2010. Poputrion standard deviation for Win 1990 Population standard deviation for wins in 2010 520.991.996 15459974 14 10.51972506 1910 Were teams mere til regarding ring in 1910 or 2017 19 2.367702545 Major Ruschall Salaries by Team DIVISION TEAM 2010 PAYROLL 100 PAYROLL 2010 WINS 1990 Wies AL Cast Baltimore Orioles $81.612.500 $10,007,014 66 Boston Red So 2 $20.302 333 ALB New York Yand $200, 333.339 $20,991,310 ALE Tampa Bay Rays $71,933.471 NA NA ALF Toronto Blues $62.754.000 SIRAM, 16 AL Central Chico White Sox S305 530,000 $0 AM,230 88 94 AL Central Cleveland $61 202.966 $15.152,000 77 AL Central Detroit Tigers $12.640 $18.042,236 A Central City Royal $71,405.20 $93.873,745 67 75 AL Central Minnesota Twins 597,559,166 SIS. 106,000 74 AL West Los Angeles Arts S20463.166 $21.970,000 AL West Dakland Athletics $51.654.900 Sa. 2201 Al we Santa Maria SO $12,141,07 61 77 AL West Texas Rangers $55.250 541 $15.104,372 30 NL last Atlanta Braves S84 423,000 SEX 32,50 NL Florida Mariss $57,029,719 NA NA NL East New York Mets $134 422.42 $22.416 8.34 Sa Na Philadelphia Phillies $141.20.3 $22.993,067 77 NL Cast Washington Nationals 561.400.000 516.656,385 69 NL Central Choco $5.000.000 $14.490,000 IN Cantral Cincinnati Reds $71,761.543 $14, 70,00 91 NL Central Houston Astros 932,355,500 $48.800,000 NL Central Milwaukee S2 $20.019,202 NL Central Pittsburgh Pirates $94.000 $1,650,000 NL Central St. Louis Cardinals $93.540.31 $40223 34 86 NL West Ancona Dumondback $200 NA 00 NA NL West Colorado Rock 227.000 NA NA NL West Los Angeles Dodgers $95.350.000 $21.616.74 NL West San Diego Padres $32,799 300 $38.500.334 75 NL West San Francisco Giants $38.641.21 $10.942,333 85 "The Washington National were the Montreal Lapos in 1990 NA=The team did not exist in 8188 salas 3 BS 82829 8888888 Correlation between the number of wins a team earned in 2010 and the amount om ww mount 19 20 21 534 Correlation between the number of wins a team earned in 1996 and the amount teressalamount 2010 is the relationship between wins and salary stronger in 1990 20301 How many wins could a team expect to earn in 2010 it they paid $150.000.000 in salary Salary Amount $150,000,000 What is the 95% confidence interval*** for wins in 2010? Upper 95confidence intervallevel 22 14 29 36 Lower confidence interval level BMI Baseball Head 11 6 12 6 In cell 127, use the FORECAST LINEAR function (or the FORECAST function if you are not using Excel 2016) to determine how many games a team could expect to win in 2010 if they paid $150,000,000 in salary. Reference the appropriate ranges in the table and the salary amount as the arguments for your function. In cell 131, use the CONFIDENCE.NORM function to determine the 95% confidence interval for wins in 2010. Reference the appropriate calculations for size and standard deviation as arguments for your function, In cell 133, calculate the upper limit for the 95% confidence interval for your win prediction for a team paying $150,000,000 in salaries. Reference your prediction and the confidence interval calculation for your formula In cell 135, calculate the lower limit for the 95% confidence interval for your win prediction for a team paying $150,000,000 in salaries. Reference your prediction and the confidence interval calculation for your formula. 13 3 14 127 " . Statistical Analyse Response 4 5 AL 30 51747. Number of MLB Tears in 1990 Number of leta 2000 Average salary for the team in 1990 Average salary for the team in 2010. Poputrion standard deviation for Win 1990 Population standard deviation for wins in 2010 520.991.996 15459974 14 10.51972506 1910 Were teams mere til regarding ring in 1910 or 2017 19 2.367702545 Major Ruschall Salaries by Team DIVISION TEAM 2010 PAYROLL 100 PAYROLL 2010 WINS 1990 Wies AL Cast Baltimore Orioles $81.612.500 $10,007,014 66 Boston Red So 2 $20.302 333 ALB New York Yand $200, 333.339 $20,991,310 ALE Tampa Bay Rays $71,933.471 NA NA ALF Toronto Blues $62.754.000 SIRAM, 16 AL Central Chico White Sox S305 530,000 $0 AM,230 88 94 AL Central Cleveland $61 202.966 $15.152,000 77 AL Central Detroit Tigers $12.640 $18.042,236 A Central City Royal $71,405.20 $93.873,745 67 75 AL Central Minnesota Twins 597,559,166 SIS. 106,000 74 AL West Los Angeles Arts S20463.166 $21.970,000 AL West Dakland Athletics $51.654.900 Sa. 2201 Al we Santa Maria SO $12,141,07 61 77 AL West Texas Rangers $55.250 541 $15.104,372 30 NL last Atlanta Braves S84 423,000 SEX 32,50 NL Florida Mariss $57,029,719 NA NA NL East New York Mets $134 422.42 $22.416 8.34 Sa Na Philadelphia Phillies $141.20.3 $22.993,067 77 NL Cast Washington Nationals 561.400.000 516.656,385 69 NL Central Choco $5.000.000 $14.490,000 IN Cantral Cincinnati Reds $71,761.543 $14, 70,00 91 NL Central Houston Astros 932,355,500 $48.800,000 NL Central Milwaukee S2 $20.019,202 NL Central Pittsburgh Pirates $94.000 $1,650,000 NL Central St. Louis Cardinals $93.540.31 $40223 34 86 NL West Ancona Dumondback $200 NA 00 NA NL West Colorado Rock 227.000 NA NA NL West Los Angeles Dodgers $95.350.000 $21.616.74 NL West San Diego Padres $32,799 300 $38.500.334 75 NL West San Francisco Giants $38.641.21 $10.942,333 85 "The Washington National were the Montreal Lapos in 1990 NA=The team did not exist in 8188 salas 3 BS 82829 8888888 Correlation between the number of wins a team earned in 2010 and the amount om ww mount 19 20 21 534 Correlation between the number of wins a team earned in 1996 and the amount teressalamount 2010 is the relationship between wins and salary stronger in 1990 20301 How many wins could a team expect to earn in 2010 it they paid $150.000.000 in salary Salary Amount $150,000,000 What is the 95% confidence interval*** for wins in 2010? Upper 95confidence intervallevel 22 14 29 36 Lower confidence interval level BMI Baseball Head
Step by Step Solution
There are 3 Steps involved in it

Get step-by-step solutions from verified subject matter experts