

Question: Need help particularly with number 4. Number 3 was provided as reference the trace for (sous collaborate with your lab partner to life the transient
Need help particularly with number 4. Number 3 was provided as reference
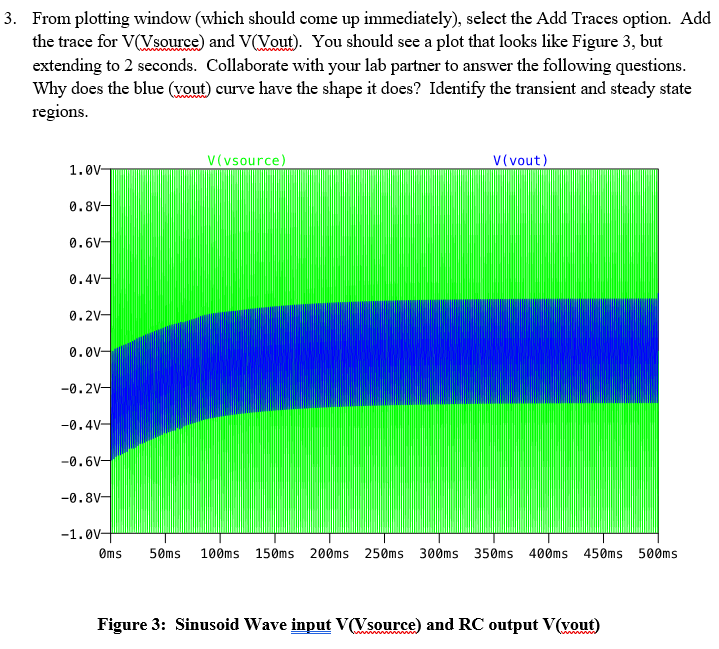
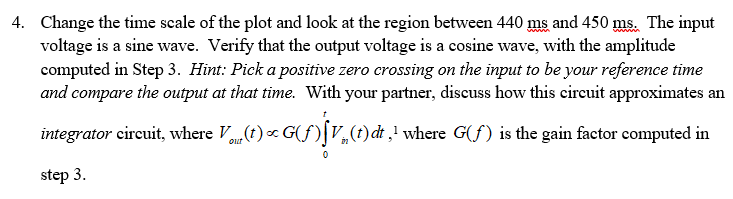
the trace for (sous collaborate with your lab partner to life the transient and ste 3. From plotting window (which should come up immediately), select the Add Traces option. Add the trace for V(source) and (Vout). You should see a plot that looks like Figure 3, but extending to 2 seconds. Collaborate with your lab partner to answer the following questions. Why does the blue (vout) curve have the shape it does? Identify the transient and steady state regions. V(vsource) V(vout) 1.0V- 0.8v- 0.6v- 0.4v- 0.2v- 0.0v- -0.21 -0.4v- -0.6V- -0.8V- -1.v- oms 50ms 100ms 150ms 200ms 250ms 300ms 350ms 400ms 450ms 500ms Figure 3: Sinusoid Wave input V(source) and RC output V(vout) 4. Change the time scale of the plot and look at the region between 440 ms and 450 ms. The input voltage is a sine wave. Verify that the output voltage is a cosine wave, with the amplitude computed in Step 3. Hint: Pick a positive zero crossing on the input to be your reference time and compare the output at that time. With your partner, discuss how this circuit approximates an integrator circuit, where Vou (t) . GB V.(t)dt, where G(f) is the gain factor computed in step 3. the trace for (sous collaborate with your lab partner to life the transient and ste 3. From plotting window (which should come up immediately), select the Add Traces option. Add the trace for V(source) and (Vout). You should see a plot that looks like Figure 3, but extending to 2 seconds. Collaborate with your lab partner to answer the following questions. Why does the blue (vout) curve have the shape it does? Identify the transient and steady state regions. V(vsource) V(vout) 1.0V- 0.8v- 0.6v- 0.4v- 0.2v- 0.0v- -0.21 -0.4v- -0.6V- -0.8V- -1.v- oms 50ms 100ms 150ms 200ms 250ms 300ms 350ms 400ms 450ms 500ms Figure 3: Sinusoid Wave input V(source) and RC output V(vout) 4. Change the time scale of the plot and look at the region between 440 ms and 450 ms. The input voltage is a sine wave. Verify that the output voltage is a cosine wave, with the amplitude computed in Step 3. Hint: Pick a positive zero crossing on the input to be your reference time and compare the output at that time. With your partner, discuss how this circuit approximates an integrator circuit, where Vou (t) . GB V.(t)dt, where G(f) is the gain factor computed in step 3
Step by Step Solution
There are 3 Steps involved in it

Get step-by-step solutions from verified subject matter experts