

Question: Need help please Consider the boxplot below. 19 34 44 61 79 + 10 20 30 40 50 60 70 80 data Q a. What
Need help please
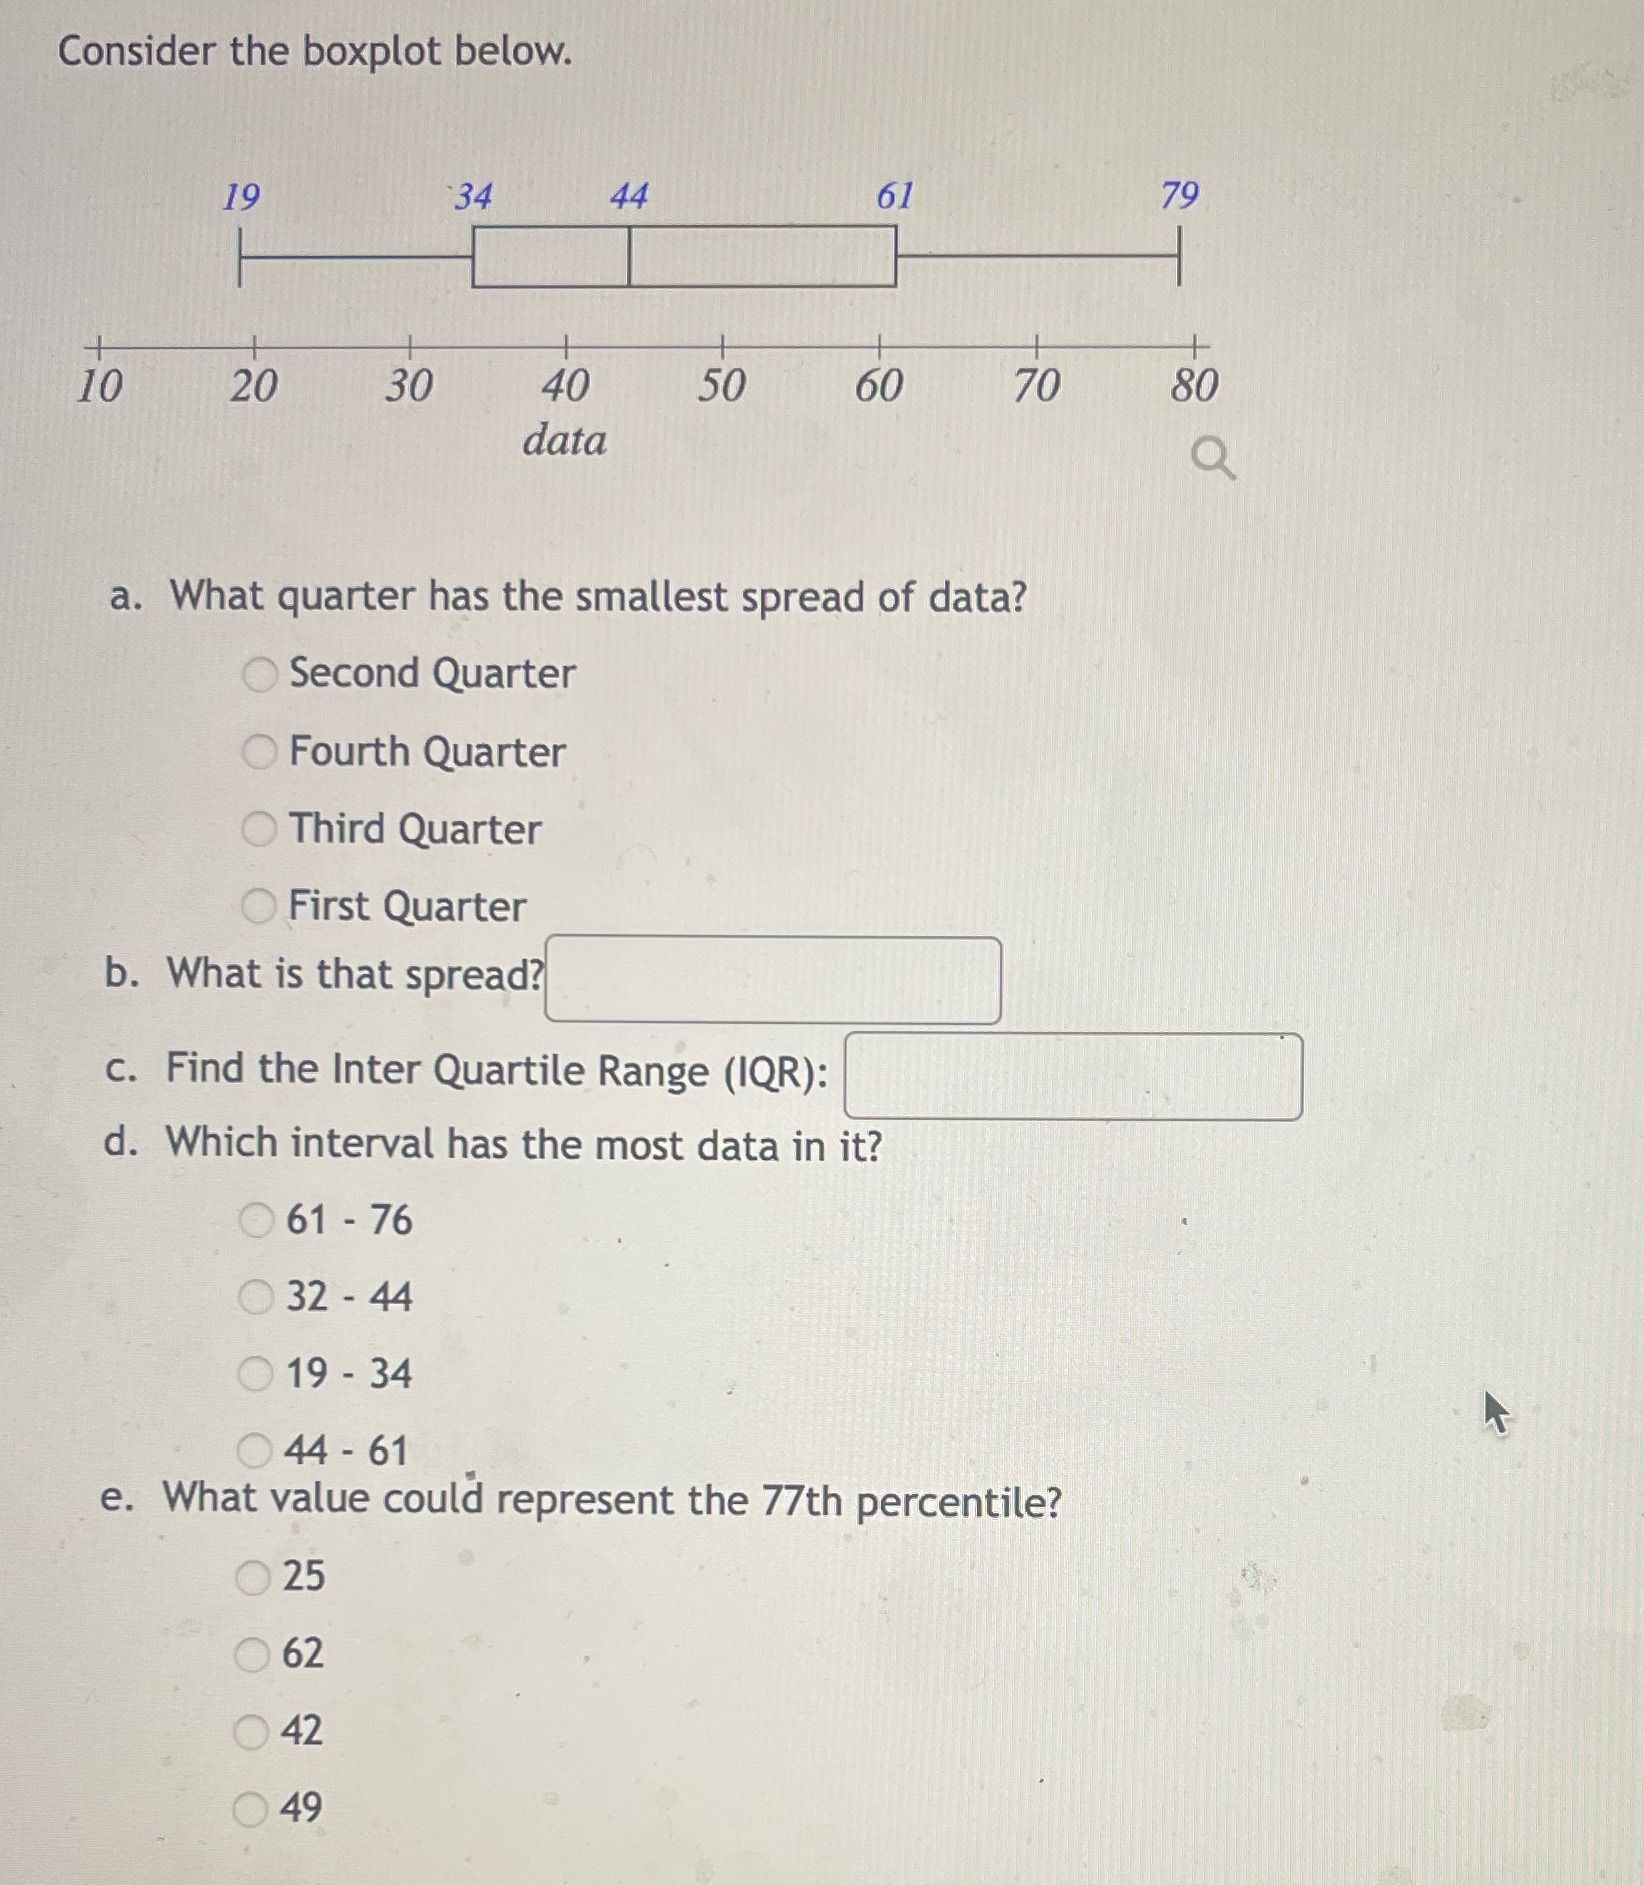
Consider the boxplot below. 19 34 44 61 79 + 10 20 30 40 50 60 70 80 data Q a. What quarter has the smallest spread of data? Second Quarter Fourth Quarter Third Quarter First Quarter b. What is that spread? c. Find the Inter Quartile Range (IQR): d. Which interval has the most data in it? 61 - 76 32 - 44 19 - 34 44 - 61 e. What value could represent the 77th percentile? 25 62 O 42 O 49
Step by Step Solution
There are 3 Steps involved in it
1 Expert Approved Answer
Step: 1 Unlock

Question Has Been Solved by an Expert!
Get step-by-step solutions from verified subject matter experts
Step: 2 Unlock
Step: 3 Unlock