

Question: Need help! Please help answer the following ASAP! Cost Information Table Operating Constraints Table: Here is the template: 1. Please provide an executive summary after
Need help! Please help answer the following ASAP!
Cost Information Table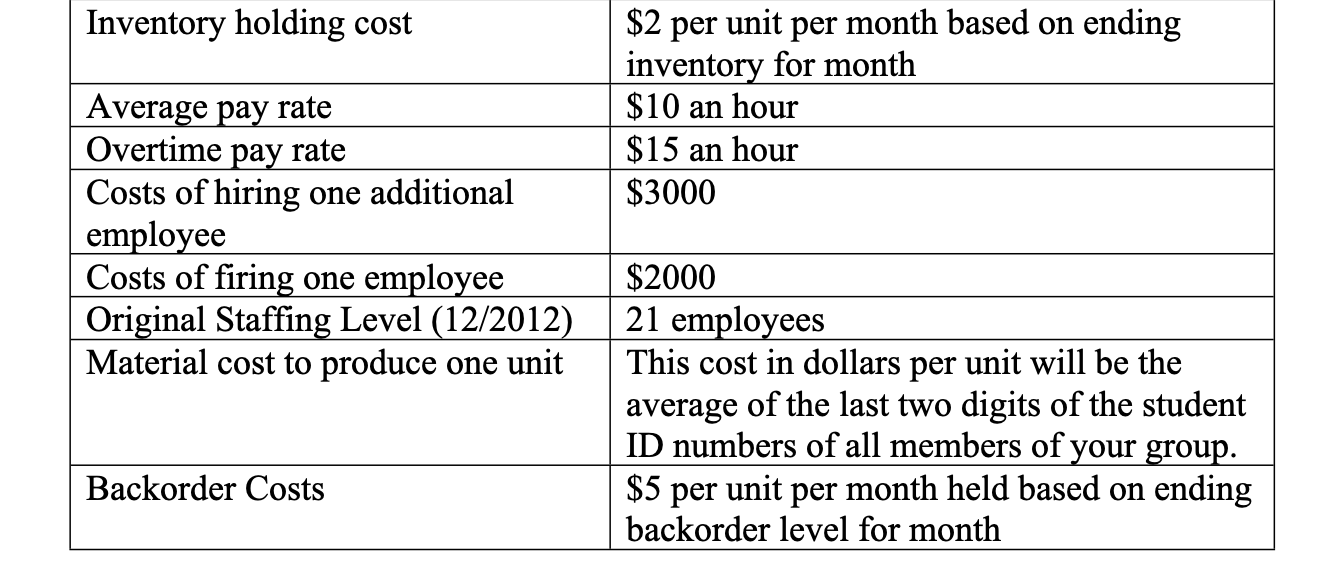
Operating Constraints Table:
 Here is the template:
1. Please provide an executive summary after answering.
 there should be three tables in total.
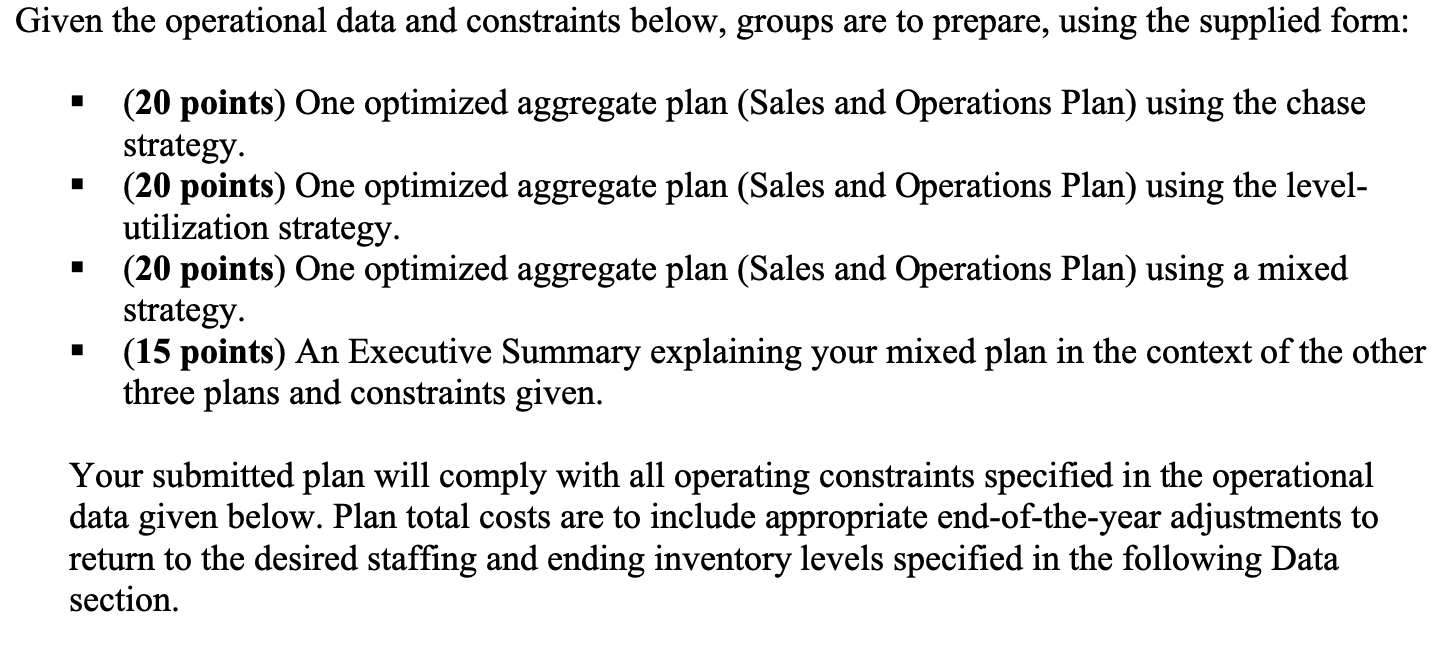
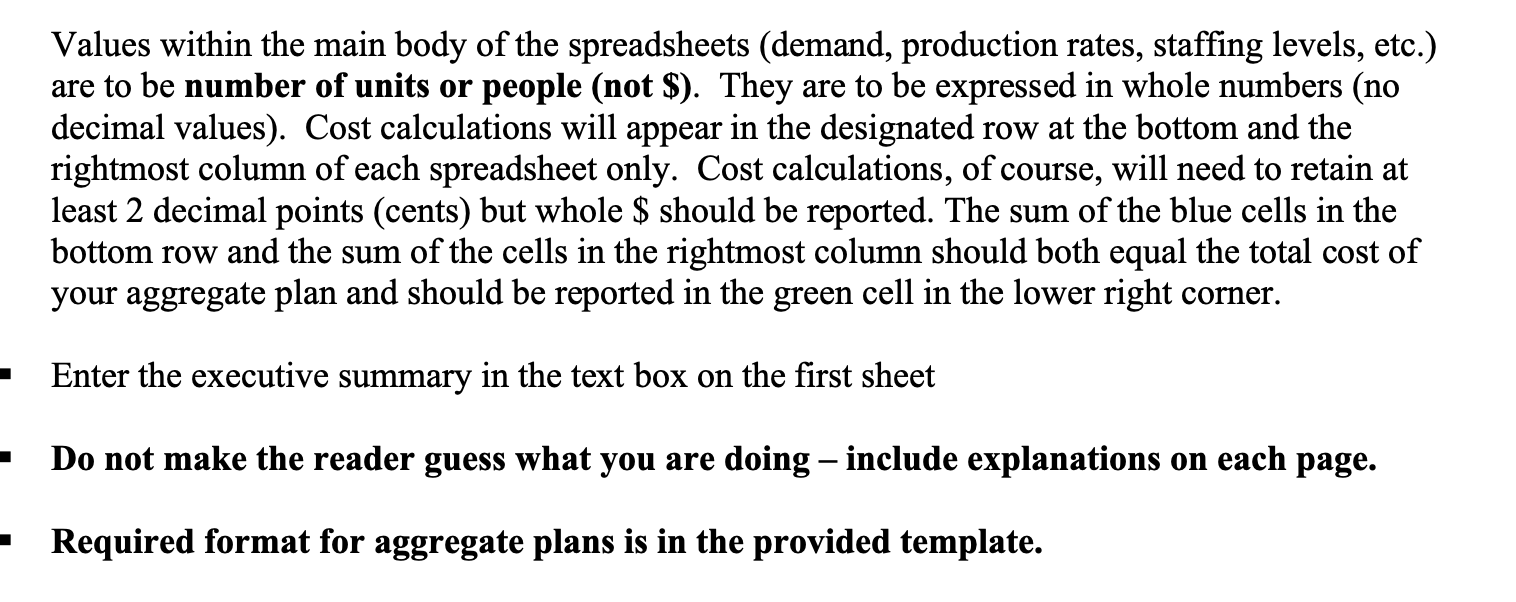
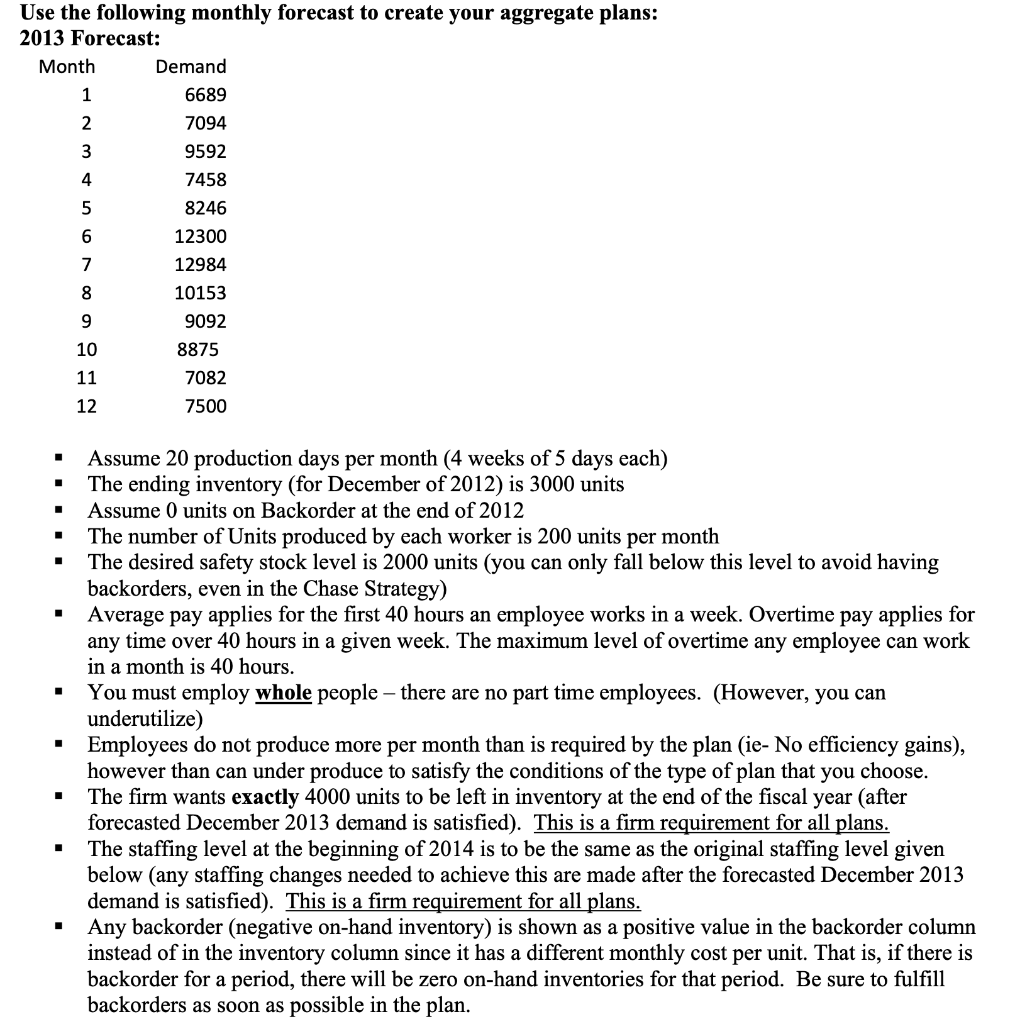
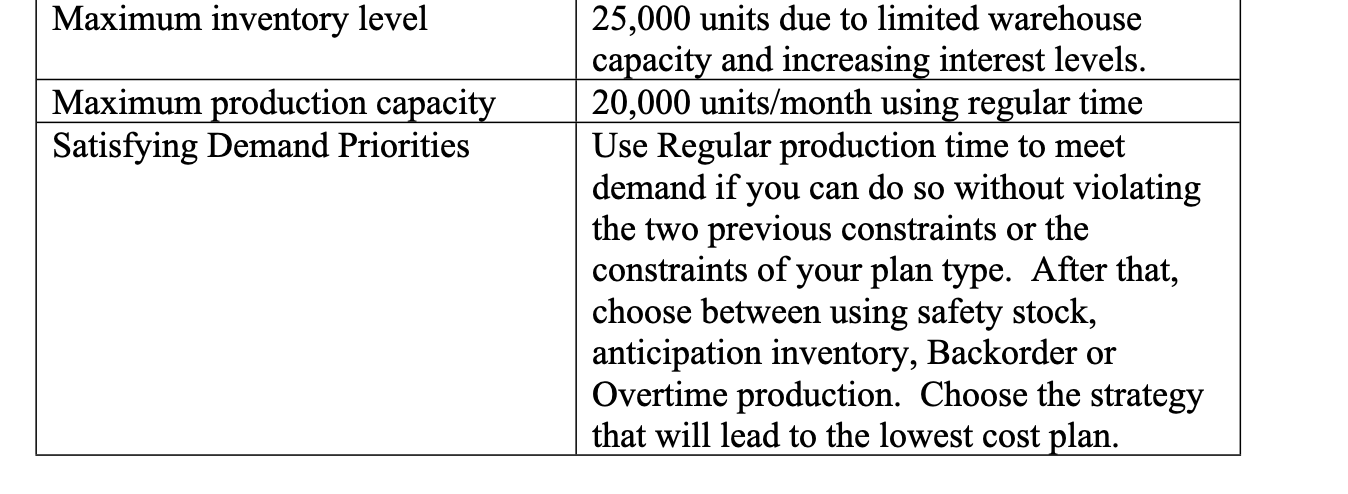
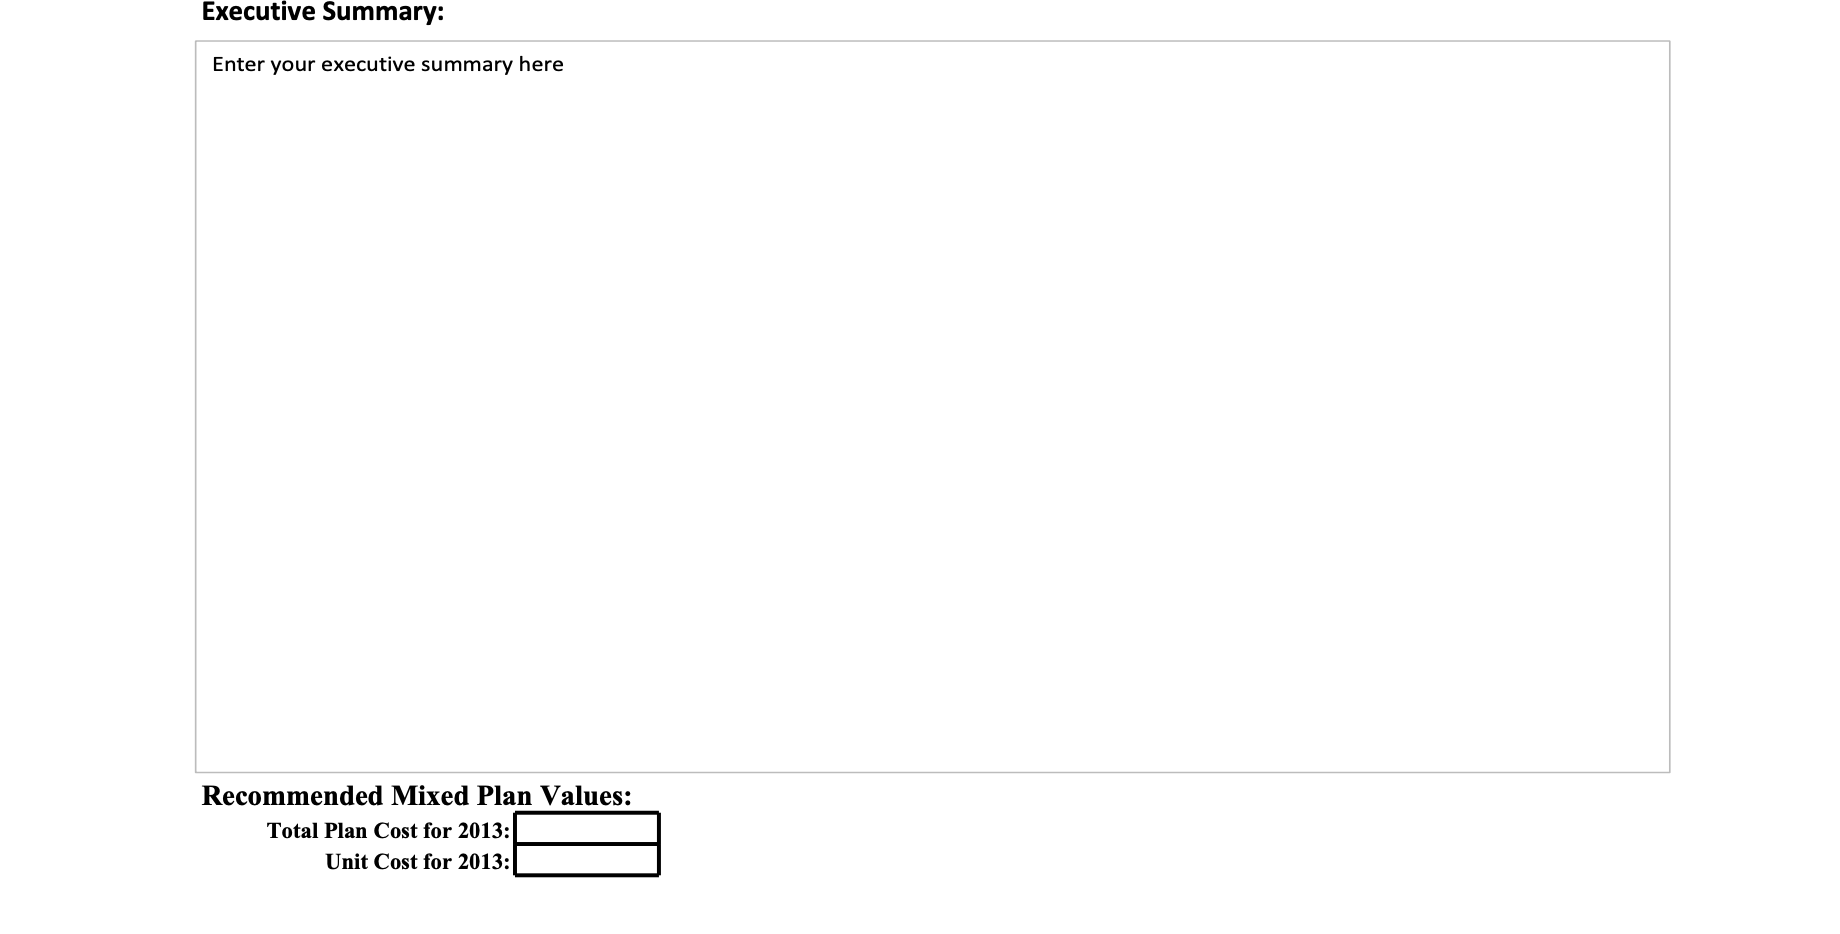
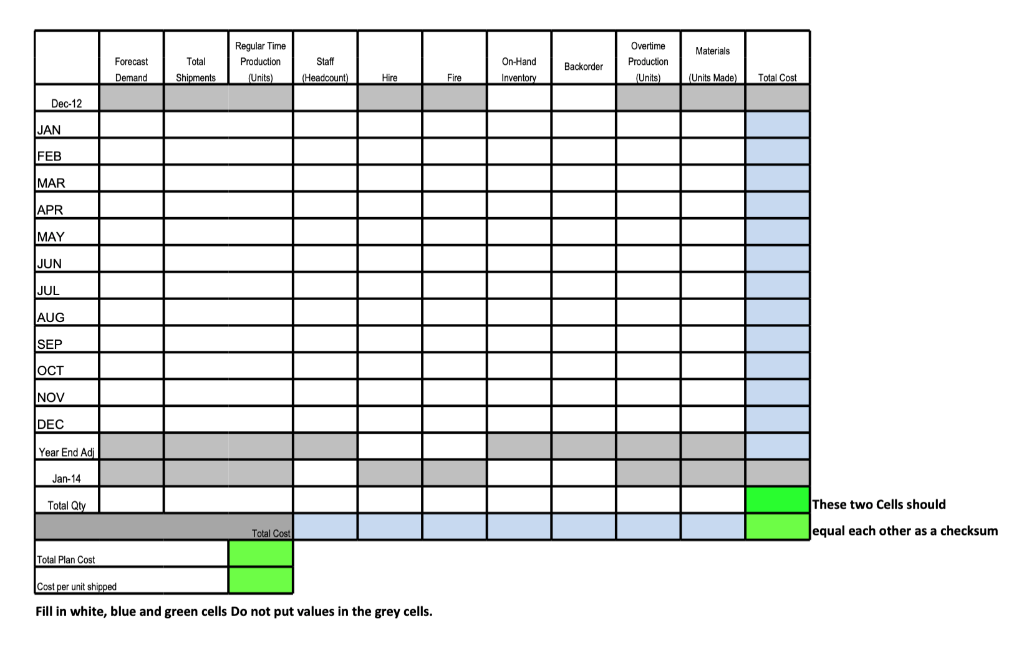
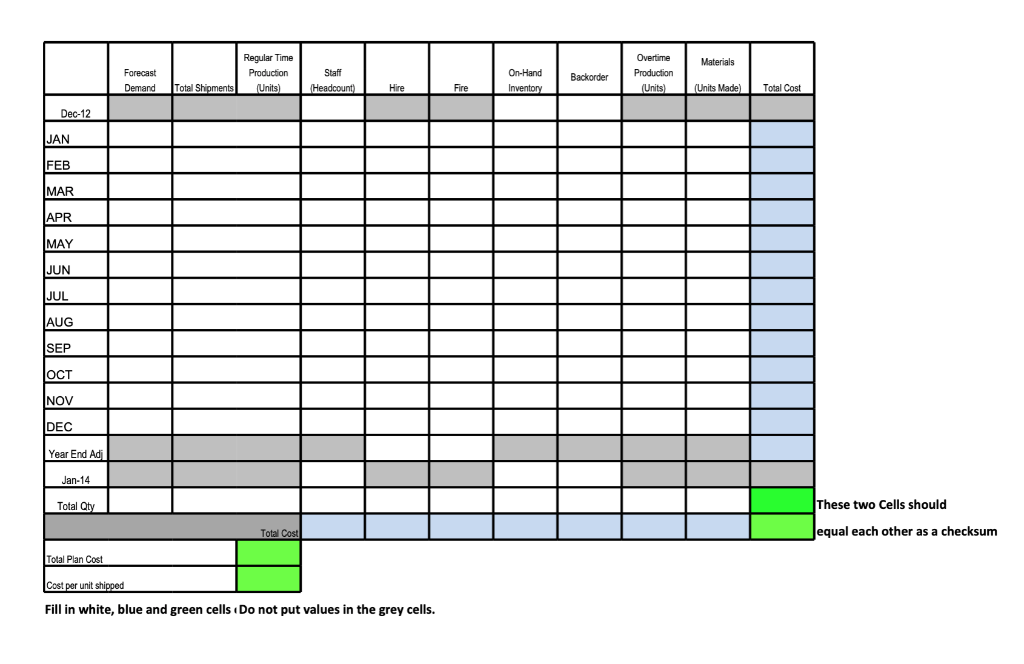
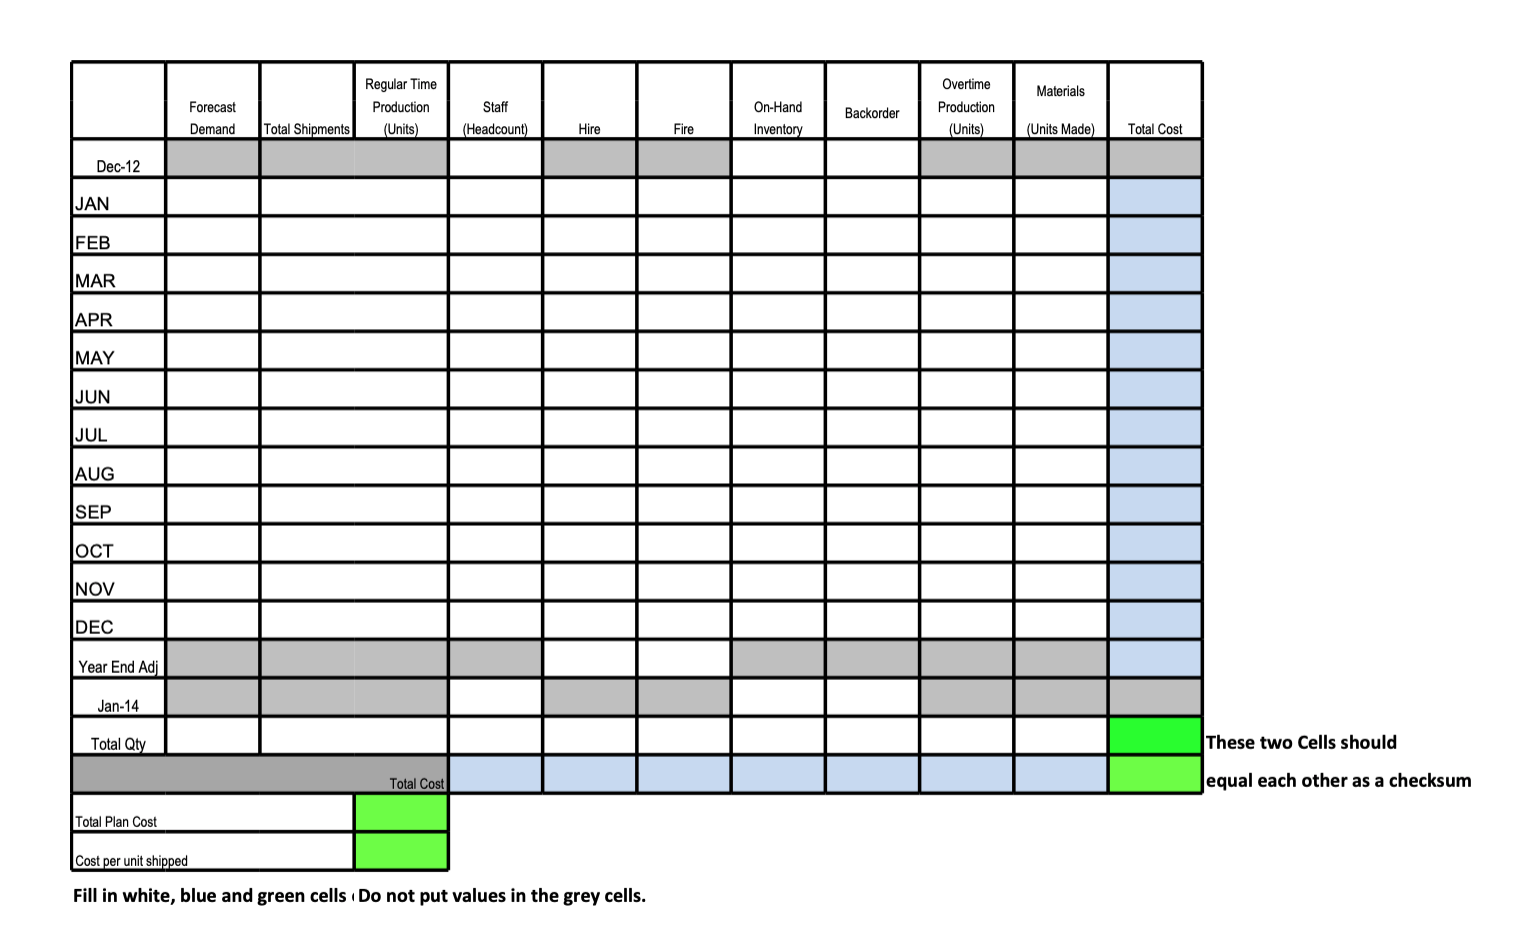
Given the operational data and constraints below, groups are to prepare, using the supplied form: (20 points) One optimized aggregate plan (Sales and Operations Plan) using the chase strategy. (20 points) One optimized aggregate plan (Sales and Operations Plan) using the level- utilization strategy. (20 points) One optimized aggregate plan (Sales and Operations Plan) using a mixed strategy (15 points) An Executive Summary explaining your mixed plan in the context of the other three plans and constraints given. 1 Your submitted plan will comply with all operating constraints specified in the operational data given below. Plan total costs are to include appropriate end-of-the-year adjustments to return to the desired staffing and ending inventory levels specified in the following Data section. Values within the main body of the spreadsheets (demand, production rates, staffing levels, etc.) are to be number of units or people (not $). They are to be expressed in whole numbers (no decimal values). Cost calculations will appear in the designated row at the bottom and the rightmost column of each spreadsheet only. Cost calculations, of course, will need to retain at least 2 decimal points (cents) but whole $ should be reported. The sum of the blue cells in the bottom row and the sum of the cells in the rightmost column should both equal the total cost of your aggregate plan and should be reported in the green cell in the lower right corner. Enter the executive summary in the text box on the first sheet Do not make the reader guess what you are doing - include explanations on each page. Required format for aggregate plans is in the provided template. Use the following monthly forecast to create your aggregate plans: 2013 Forecast: Month Demand 1 6689 2 7094 3 9592 4 7458 5 8246 6 12300 7 12984 8 10153 9 9092 10 8875 11 7082 12 7500 Assume 20 production days per month (4 weeks of 5 days each) The ending inventory (for December of 2012) is 3000 units Assume 0 units on Backorder at the end of 2012 The number of Units produced by each worker is 200 units per month The desired safety stock level is 2000 units (you can only fall below this level to avoid having backorders, even in the Chase Strategy) Average pay applies for the first 40 hours an employee works in a week. Overtime pay applies for any time over 40 hours in a given week. The maximum level of overtime any employee can work in a month is 40 hours. You must employ whole people there are no part time employees. (However, you can underutilize) Employees do not produce more per month than is required by the plan (ie- No efficiency gains), however than can under produce to satisfy the conditions of the type of plan that you choose. The firm wants exactly 4000 units to be left in inventory at the end of the fiscal year (after forecasted December 2013 demand is satisfied). This is a firm requirement for all plans. The staffing level at the beginning of 2014 is to be the same as the original staffing level given below (any staffing changes need to achieve this are made after the forecasted December 2013 demand is satisfied). This is a firm requirement for all plans. Any backorder (negative on-hand inventory) is shown as a positive value in the backorder column instead of in the inventory column since it has a different monthly cost per unit. That is, if there is backorder for a period, there will be zero on-hand inventories for that period. Be sure to fulfill backorders as soon as possible in the plan. Inventory holding cost $2 per unit per month based on ending inventory for month $10 an hour $15 an hour $3000 Average pay rate Overtime pay rate Costs of hiring one additional employee Costs of firing one employee Original Staffing Level (12/2012) Material cost to produce one unit $2000 21 employees This cost in dollars per unit will be the average of the last two digits of the student ID numbers of all members of your group. $5 per unit per month held based on ending backorder level for month Backorder Costs Maximum inventory level Maximum production capacity Satisfying Demand Priorities 25,000 units due to limited warehouse capacity and increasing interest levels. 20,000 units/month using regular time Use Regular production time to meet demand if you can do so without violating the two previous constraints or the constraints of your plan type. After that, choose between using safety stock, anticipation inventory, Backorder or Overtime production. Choose the strategy that will lead to the lowest cost plan. Executive Summary: Enter your executive summary here Recommended Mixed Plan Values: Total Plan Cost for 2013: Unit Cost for 2013: Materials Forecast Demand Staff Regular Time Production (Units) Total Shipments Backorder On-Hand Inventory Overtime Production (Units) (Headcount) Hire Fire (Units Made) Total Cost Dec-12 JAN FEB MAR APR MAY JUN JUL AUG SEP OCT NOV DEC Year End Adj Jan-14 Total Qty These two Cells should equal each other as a checksum Total Cost Total Plan Cost Cost per unit shipped Fill in white, blue and green cells Do not put values in the grey cells. Regular Time Materials Forecast Production Staff (Headcount On-Hand Inventory Backorder Demand Overtime Production (Units) Total Shipments (Units) Hire Fire (Units Made Total Cost Dec-12 JAN FEB MAR APR MAY JUN JUL AUG SEP OCT NOV DEC Year End Adi ! Jan-14 Total Qt These two Cells should Total Cost equal each other as a checksum Total Plan Cost Cost per unit shipped Fill in white, blue and green cells (Do not put values in the grey cells. Materials Forecast Demand Regular Time Production (Units) Staff (Headcount) On-Hand Inventory Backorder Backorder Total Shipments Overtime Production (Units) Hire Fire (Units Made) Total Cost Dec-12 JAN FEB MAR APR MAY JUN JUL AUG SEP OCT NOV DEC Year End Adj Jan-14 Total Qty These two Cells should Total Cost equal each other as a checksum Total Plan Cost Cost per unit shipped Fill in white, blue and green cells (Do not put values in the grey cells. Given the operational data and constraints below, groups are to prepare, using the supplied form: (20 points) One optimized aggregate plan (Sales and Operations Plan) using the chase strategy. (20 points) One optimized aggregate plan (Sales and Operations Plan) using the level- utilization strategy. (20 points) One optimized aggregate plan (Sales and Operations Plan) using a mixed strategy (15 points) An Executive Summary explaining your mixed plan in the context of the other three plans and constraints given. 1 Your submitted plan will comply with all operating constraints specified in the operational data given below. Plan total costs are to include appropriate end-of-the-year adjustments to return to the desired staffing and ending inventory levels specified in the following Data section. Values within the main body of the spreadsheets (demand, production rates, staffing levels, etc.) are to be number of units or people (not $). They are to be expressed in whole numbers (no decimal values). Cost calculations will appear in the designated row at the bottom and the rightmost column of each spreadsheet only. Cost calculations, of course, will need to retain at least 2 decimal points (cents) but whole $ should be reported. The sum of the blue cells in the bottom row and the sum of the cells in the rightmost column should both equal the total cost of your aggregate plan and should be reported in the green cell in the lower right corner. Enter the executive summary in the text box on the first sheet Do not make the reader guess what you are doing - include explanations on each page. Required format for aggregate plans is in the provided template. Use the following monthly forecast to create your aggregate plans: 2013 Forecast: Month Demand 1 6689 2 7094 3 9592 4 7458 5 8246 6 12300 7 12984 8 10153 9 9092 10 8875 11 7082 12 7500 Assume 20 production days per month (4 weeks of 5 days each) The ending inventory (for December of 2012) is 3000 units Assume 0 units on Backorder at the end of 2012 The number of Units produced by each worker is 200 units per month The desired safety stock level is 2000 units (you can only fall below this level to avoid having backorders, even in the Chase Strategy) Average pay applies for the first 40 hours an employee works in a week. Overtime pay applies for any time over 40 hours in a given week. The maximum level of overtime any employee can work in a month is 40 hours. You must employ whole people there are no part time employees. (However, you can underutilize) Employees do not produce more per month than is required by the plan (ie- No efficiency gains), however than can under produce to satisfy the conditions of the type of plan that you choose. The firm wants exactly 4000 units to be left in inventory at the end of the fiscal year (after forecasted December 2013 demand is satisfied). This is a firm requirement for all plans. The staffing level at the beginning of 2014 is to be the same as the original staffing level given below (any staffing changes need to achieve this are made after the forecasted December 2013 demand is satisfied). This is a firm requirement for all plans. Any backorder (negative on-hand inventory) is shown as a positive value in the backorder column instead of in the inventory column since it has a different monthly cost per unit. That is, if there is backorder for a period, there will be zero on-hand inventories for that period. Be sure to fulfill backorders as soon as possible in the plan. Inventory holding cost $2 per unit per month based on ending inventory for month $10 an hour $15 an hour $3000 Average pay rate Overtime pay rate Costs of hiring one additional employee Costs of firing one employee Original Staffing Level (12/2012) Material cost to produce one unit $2000 21 employees This cost in dollars per unit will be the average of the last two digits of the student ID numbers of all members of your group. $5 per unit per month held based on ending backorder level for month Backorder Costs Maximum inventory level Maximum production capacity Satisfying Demand Priorities 25,000 units due to limited warehouse capacity and increasing interest levels. 20,000 units/month using regular time Use Regular production time to meet demand if you can do so without violating the two previous constraints or the constraints of your plan type. After that, choose between using safety stock, anticipation inventory, Backorder or Overtime production. Choose the strategy that will lead to the lowest cost plan. Executive Summary: Enter your executive summary here Recommended Mixed Plan Values: Total Plan Cost for 2013: Unit Cost for 2013: Materials Forecast Demand Staff Regular Time Production (Units) Total Shipments Backorder On-Hand Inventory Overtime Production (Units) (Headcount) Hire Fire (Units Made) Total Cost Dec-12 JAN FEB MAR APR MAY JUN JUL AUG SEP OCT NOV DEC Year End Adj Jan-14 Total Qty These two Cells should equal each other as a checksum Total Cost Total Plan Cost Cost per unit shipped Fill in white, blue and green cells Do not put values in the grey cells. Regular Time Materials Forecast Production Staff (Headcount On-Hand Inventory Backorder Demand Overtime Production (Units) Total Shipments (Units) Hire Fire (Units Made Total Cost Dec-12 JAN FEB MAR APR MAY JUN JUL AUG SEP OCT NOV DEC Year End Adi ! Jan-14 Total Qt These two Cells should Total Cost equal each other as a checksum Total Plan Cost Cost per unit shipped Fill in white, blue and green cells (Do not put values in the grey cells. Materials Forecast Demand Regular Time Production (Units) Staff (Headcount) On-Hand Inventory Backorder Backorder Total Shipments Overtime Production (Units) Hire Fire (Units Made) Total Cost Dec-12 JAN FEB MAR APR MAY JUN JUL AUG SEP OCT NOV DEC Year End Adj Jan-14 Total Qty These two Cells should Total Cost equal each other as a checksum Total Plan Cost Cost per unit shipped Fill in white, blue and green cells (Do not put values in the grey cells
Step by Step Solution
There are 3 Steps involved in it

Get step-by-step solutions from verified subject matter experts