

Question: Need help please The scatter plot shows the number of strawberries that have been picked on the farm during the month of February: 80 Number
Need help please
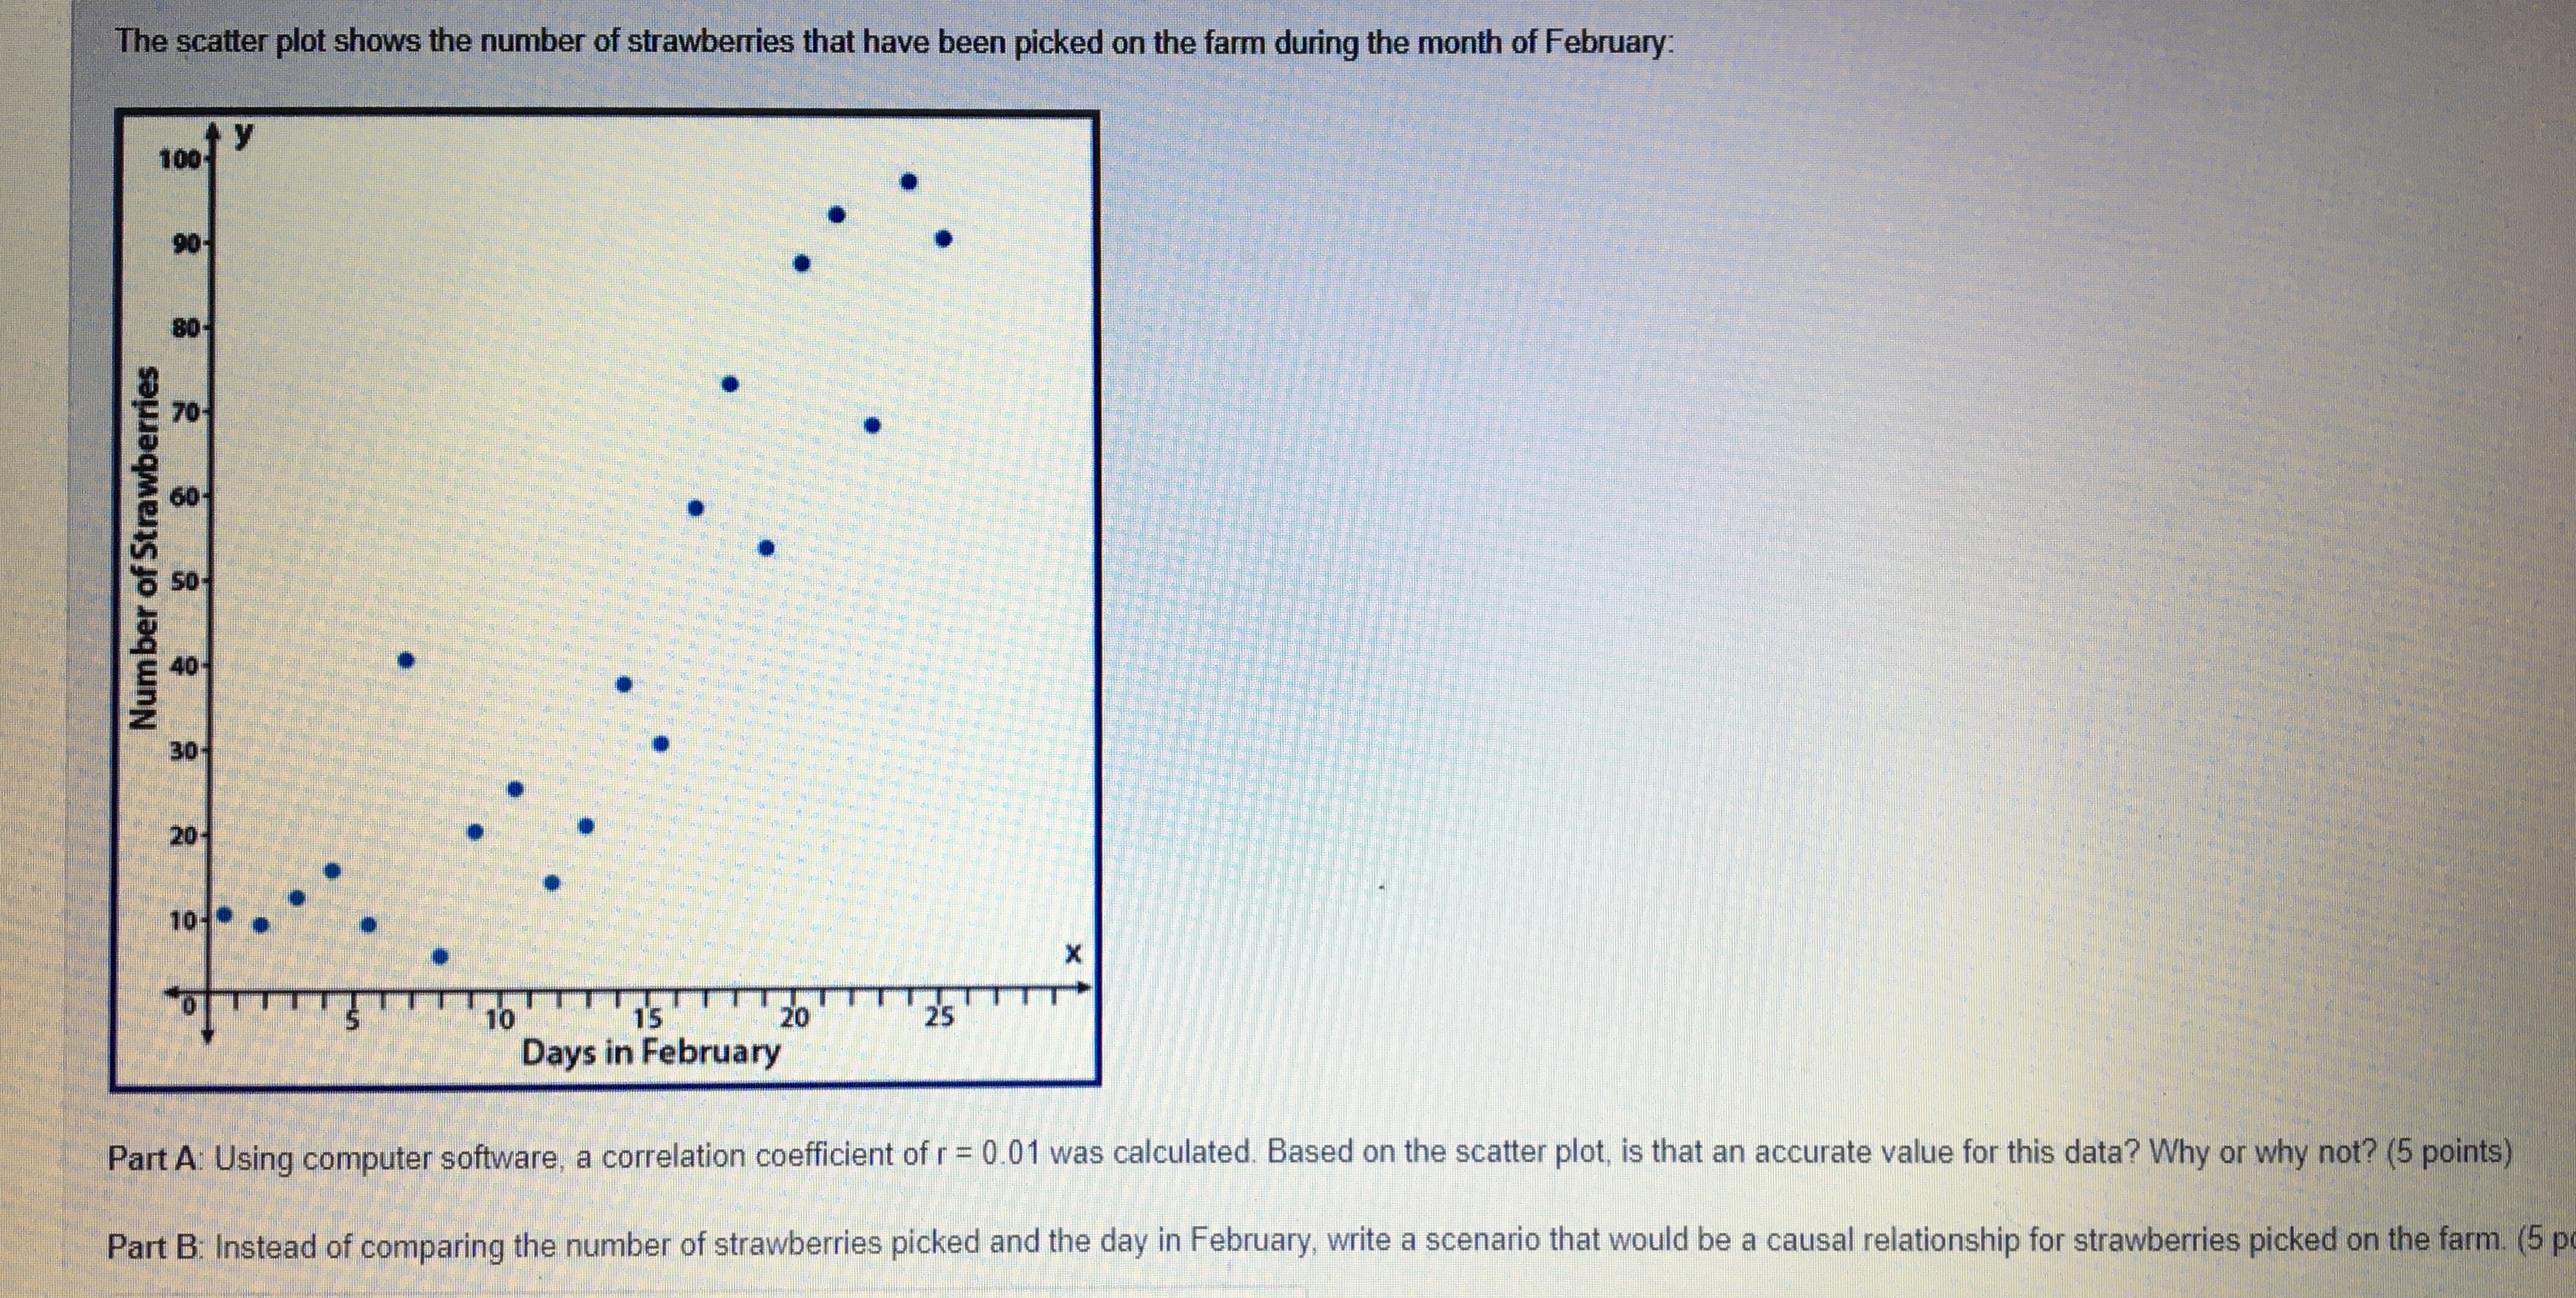
The scatter plot shows the number of strawberries that have been picked on the farm during the month of February: 80 Number of Strawberries 70 40 30 20 10- X 10 15 20 25 Days in February Part A: Using computer software, a correlation coefficient of r = 0.01 was calculated. Based on the scatter plot, is that an accurate value for this data? Why or why not? (5 points) Part B: Instead of comparing the number of strawberries picked and the day in February, write a scenario that would be a causal relationship for strawberries picked on the farm. (5 p
Step by Step Solution
There are 3 Steps involved in it
1 Expert Approved Answer
Step: 1 Unlock

Question Has Been Solved by an Expert!
Get step-by-step solutions from verified subject matter experts
Step: 2 Unlock
Step: 3 Unlock