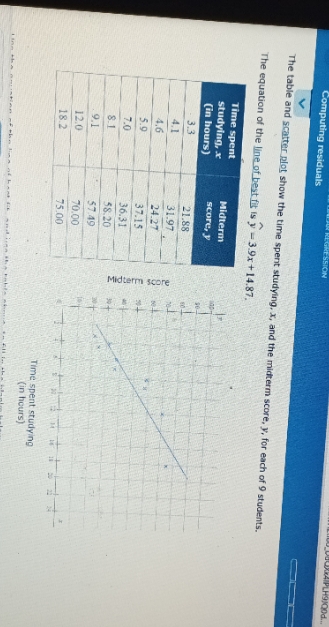
Question: need help PLHOMOOd... Computing residuals > The table and scatter plot show the time spent studying. x, and the midterm score, y, for each of

need help

need help PLHOMOOd... Computing residuals > The
PLHOMOOd... Computing residuals > The table and scatter plot show the time spent studying. x, and the midterm score, y, for each of 9 students. The equation of the line of best fit is y -- 3.9x+ 14.87. Time spent Midterm studying, x (in hours) score, P 3.3 21.88 31.97 24.27 Midterm score 5. 37.15 36.31 58.20 57.49 12.0 70.00 18.2 75.00 Time spent studying (in hours)

Step by Step Solution

There are 3 Steps involved in it

1 Expert Approved Answer
Step: 1 Unlock blur-text-image
Question Has Been Solved by an Expert!

Get step-by-step solutions from verified subject matter experts

Step: 2 Unlock
Step: 3 Unlock

Students Have Also Explored These Related Mathematics Questions!