

Question: Need help!! PS: Problem 9a, b. Do only the adjusted R squared and Mallows Cp parts. +9.9. Refer to Patient satisfaction Problem 6.15. The hospital
Need help!! PS: Problem 9a, b. Do only the adjusted R squared and Mallows Cp parts.
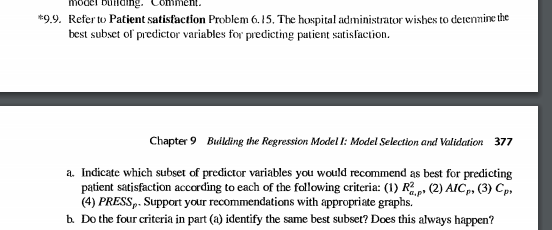
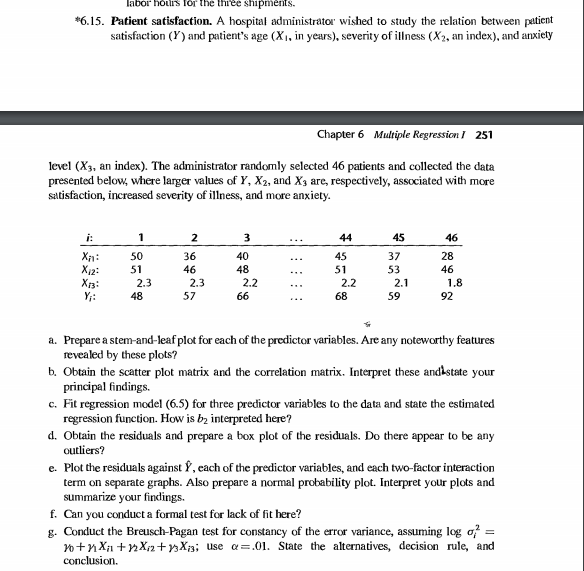
+9.9. Refer to Patient satisfaction Problem 6.15. The hospital adeninistrator wishes to determine the best subset of predictor variables for predicting patient satisfaction. Chapter 9 Building the Regression Model 1: Model Selection and Validation 377 a. Indicate which subset of predictor variables you would recommend as best for predicting patient satisfaction according to each of the following criteria: (1) Rp. (2) AICP, (3) Cpx (4) PRESS, Support your recommendations with appropriate graphs. b. Do the four criteria in part (2) identify the same best subset? Does this always happen? labor holis for ree shipments. *6.15. Patient satisfaction. A hospital administrator wished to study the relation between patient satisfaction (Y) and patient's age (X1, in years), severity of illness (X2, an index), and anxiety Chapter 6 Multiple Regression / 251 level (X3, an index). The administrator randomly selected 46 patients and collected the data presented below, where larger values of Y, X2, and X, arc, respectively, associated with more satisfaction, increased severity of illness, and more anxiety. i: 2 3 44 45 46 Xa: X12: X: Y! 1 50 51 2.3 48 36 46 2.3 57 40 48 2.2 66 45 51 2.2 68 37 53 2.1 59 28 46 1.8 92 a. Prepare a stem-and-leaf plot for each of the predictor variables. Are any noteworthy features revealed by these plots? b. Obtain the scatter plot matrix and the correlation matrix. Interpret these and state your principal findings. c. Fit regression model (6.5) for three predictor variables to the data and state the estimated regression function. How is be interpreted here? d. Obtain the residuals and prepare a box plot of the residuals. Do there appear to be any outliers? e. Plot the residuals against 9, each of the predictor variables, and each two-factor interaction term on separate graphs. Also prepare a normal probability plot. Interpret your plots and summarize your findings. f. Can you conduct a formal test for lack of fit here? g. Conduct the Breusch-Pagan test for constancy of the error variance, assuming logo Xo+X+X2+3X3; use a=.01. State the alternatives, decision rule, and conclusion. +9.9. Refer to Patient satisfaction Problem 6.15. The hospital adeninistrator wishes to determine the best subset of predictor variables for predicting patient satisfaction. Chapter 9 Building the Regression Model 1: Model Selection and Validation 377 a. Indicate which subset of predictor variables you would recommend as best for predicting patient satisfaction according to each of the following criteria: (1) Rp. (2) AICP, (3) Cpx (4) PRESS, Support your recommendations with appropriate graphs. b. Do the four criteria in part (2) identify the same best subset? Does this always happen? labor holis for ree shipments. *6.15. Patient satisfaction. A hospital administrator wished to study the relation between patient satisfaction (Y) and patient's age (X1, in years), severity of illness (X2, an index), and anxiety Chapter 6 Multiple Regression / 251 level (X3, an index). The administrator randomly selected 46 patients and collected the data presented below, where larger values of Y, X2, and X, arc, respectively, associated with more satisfaction, increased severity of illness, and more anxiety. i: 2 3 44 45 46 Xa: X12: X: Y! 1 50 51 2.3 48 36 46 2.3 57 40 48 2.2 66 45 51 2.2 68 37 53 2.1 59 28 46 1.8 92 a. Prepare a stem-and-leaf plot for each of the predictor variables. Are any noteworthy features revealed by these plots? b. Obtain the scatter plot matrix and the correlation matrix. Interpret these and state your principal findings. c. Fit regression model (6.5) for three predictor variables to the data and state the estimated regression function. How is be interpreted here? d. Obtain the residuals and prepare a box plot of the residuals. Do there appear to be any outliers? e. Plot the residuals against 9, each of the predictor variables, and each two-factor interaction term on separate graphs. Also prepare a normal probability plot. Interpret your plots and summarize your findings. f. Can you conduct a formal test for lack of fit here? g. Conduct the Breusch-Pagan test for constancy of the error variance, assuming logo Xo+X+X2+3X3; use a=.01. State the alternatives, decision rule, and conclusionStep by Step Solution
There are 3 Steps involved in it
1 Expert Approved Answer
Step: 1 Unlock

Question Has Been Solved by an Expert!
Get step-by-step solutions from verified subject matter experts
Step: 2 Unlock
Step: 3 Unlock