

Question: NEED HELP QUICK A census collected data on everyone that lived in a certain small town. The random variable X is the number of girls
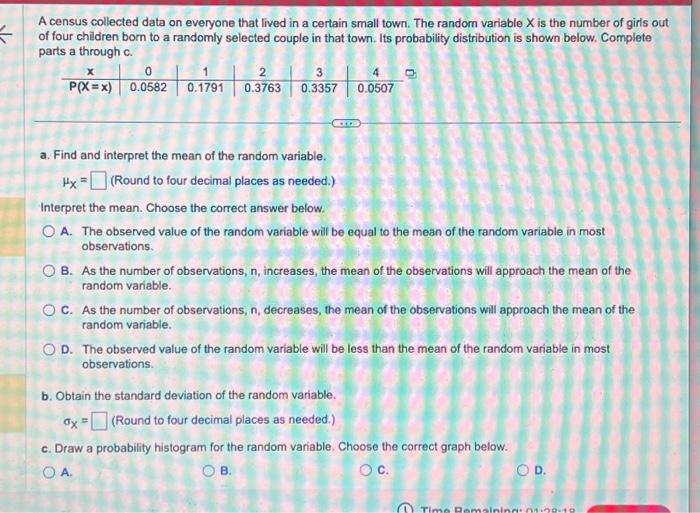
A census collected data on everyone that lived in a certain small town. The random variable X is the number of girls out of four children born to a randomly selected couple in that town. Its probability distribution is shown below. Complete parts a through c. a. Find and interpret the mean of the random variable. X= (Round to four decimal places as needed.) Interpret the mean. Choose the correct answer below. A. The observed value of the random variable will be equal to the mean of the random variable in most observations. B. As the number of observations, n, increases, the mean of the observations will approach the mean of the random variable. C. As the number of observations, n, decreases, the mean of the observations will approach the mean of the random variable. D. The observed value of the random variable will be less than the mean of the random variable in most observations. b. Obtain the standard deviation of the random variable. X=(Roundtofourdecimalplacesasneeded.) c. Draw a probability histogram for the random variable. Choose the correct graph below. A. B. c. D
Step by Step Solution
There are 3 Steps involved in it

Get step-by-step solutions from verified subject matter experts