

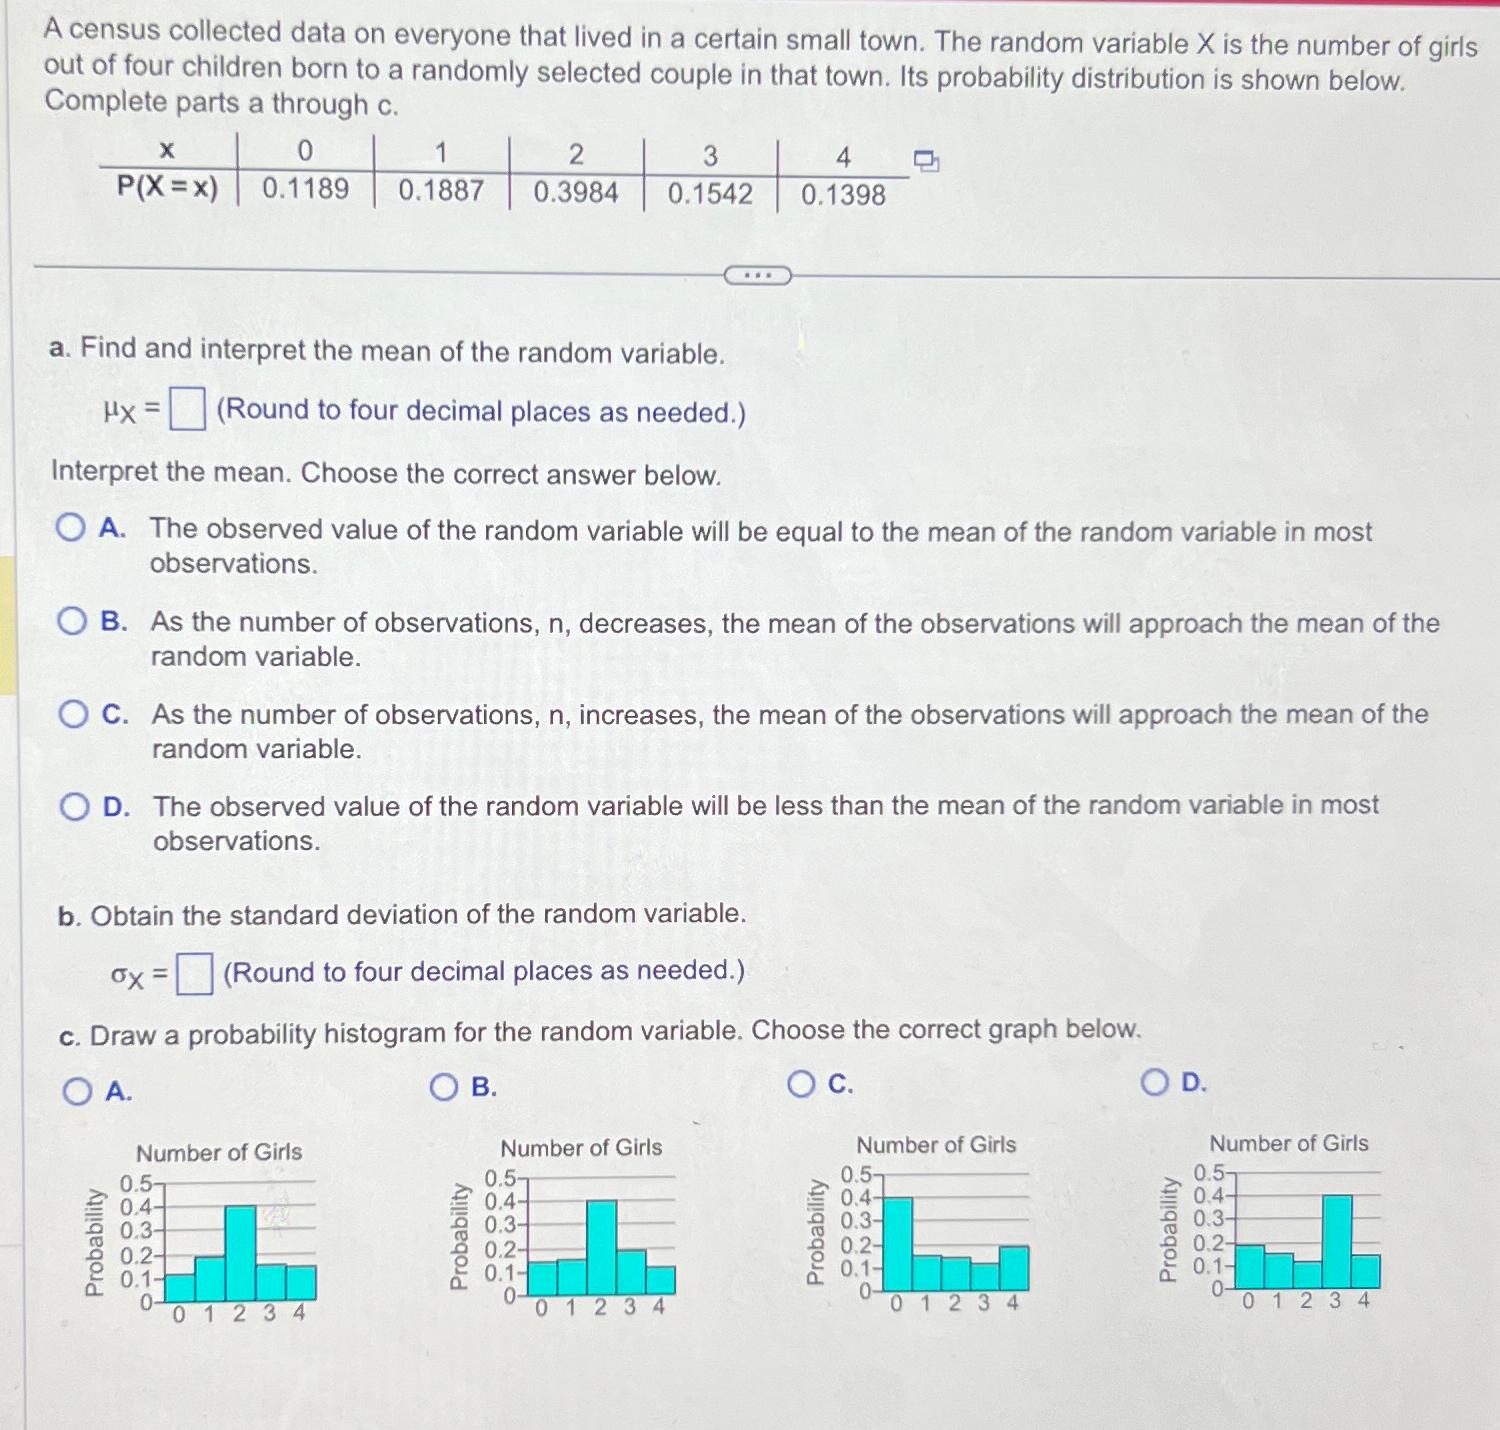
Question: A census collected data on everyone that lived in a certain small town. The random variable x is the number of girls out of four
A census collected data on everyone that lived in a certain small town. The random variable is the number of girls out of four children born to a randomly selected couple in that town. Its probability distribution is shown below. Complete parts a through
table
a Find and interpret the mean of the random variable.
Round to four decimal places as needed.
Interpret the mean. Choose the correct answer below.
A The observed value of the random variable will be equal to the mean of the random variable in most observations.
B As the number of observations, decreases, the mean of the observations will approach the mean of the random variable.
C As the number of observations, increases, the mean of the observations will approach the mean of the random variable.
D The observed value of the random variable will be less than the mean of the random variable in most observations.
b Obtain the standard deviation of the random variable.
Round to four decimal places as needed.
c Draw a probability histogram for the random variable. Choose the correct graph below.
A
B
c
D
Step by Step Solution
There are 3 Steps involved in it
1 Expert Approved Answer
Step: 1 Unlock

Question Has Been Solved by an Expert!
Get step-by-step solutions from verified subject matter experts
Step: 2 Unlock
Step: 3 Unlock