

Question: need help quick! example mentioned in question has also been attached for reference! TYSM! Stem Leaf W 04577888899 4 0022333333444444455566666677777788888889999999 5 0000000011112222223333333333333333344444444444555666666777777788999999 6 000011111111111222222233444444556666667888999 7
need help quick! example mentioned in question has also been attached for reference! TYSM!
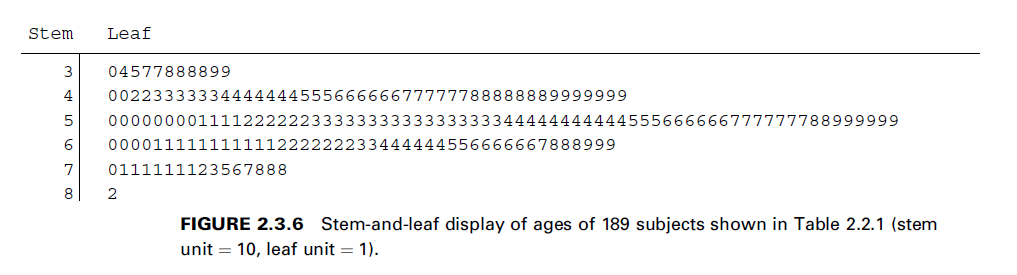
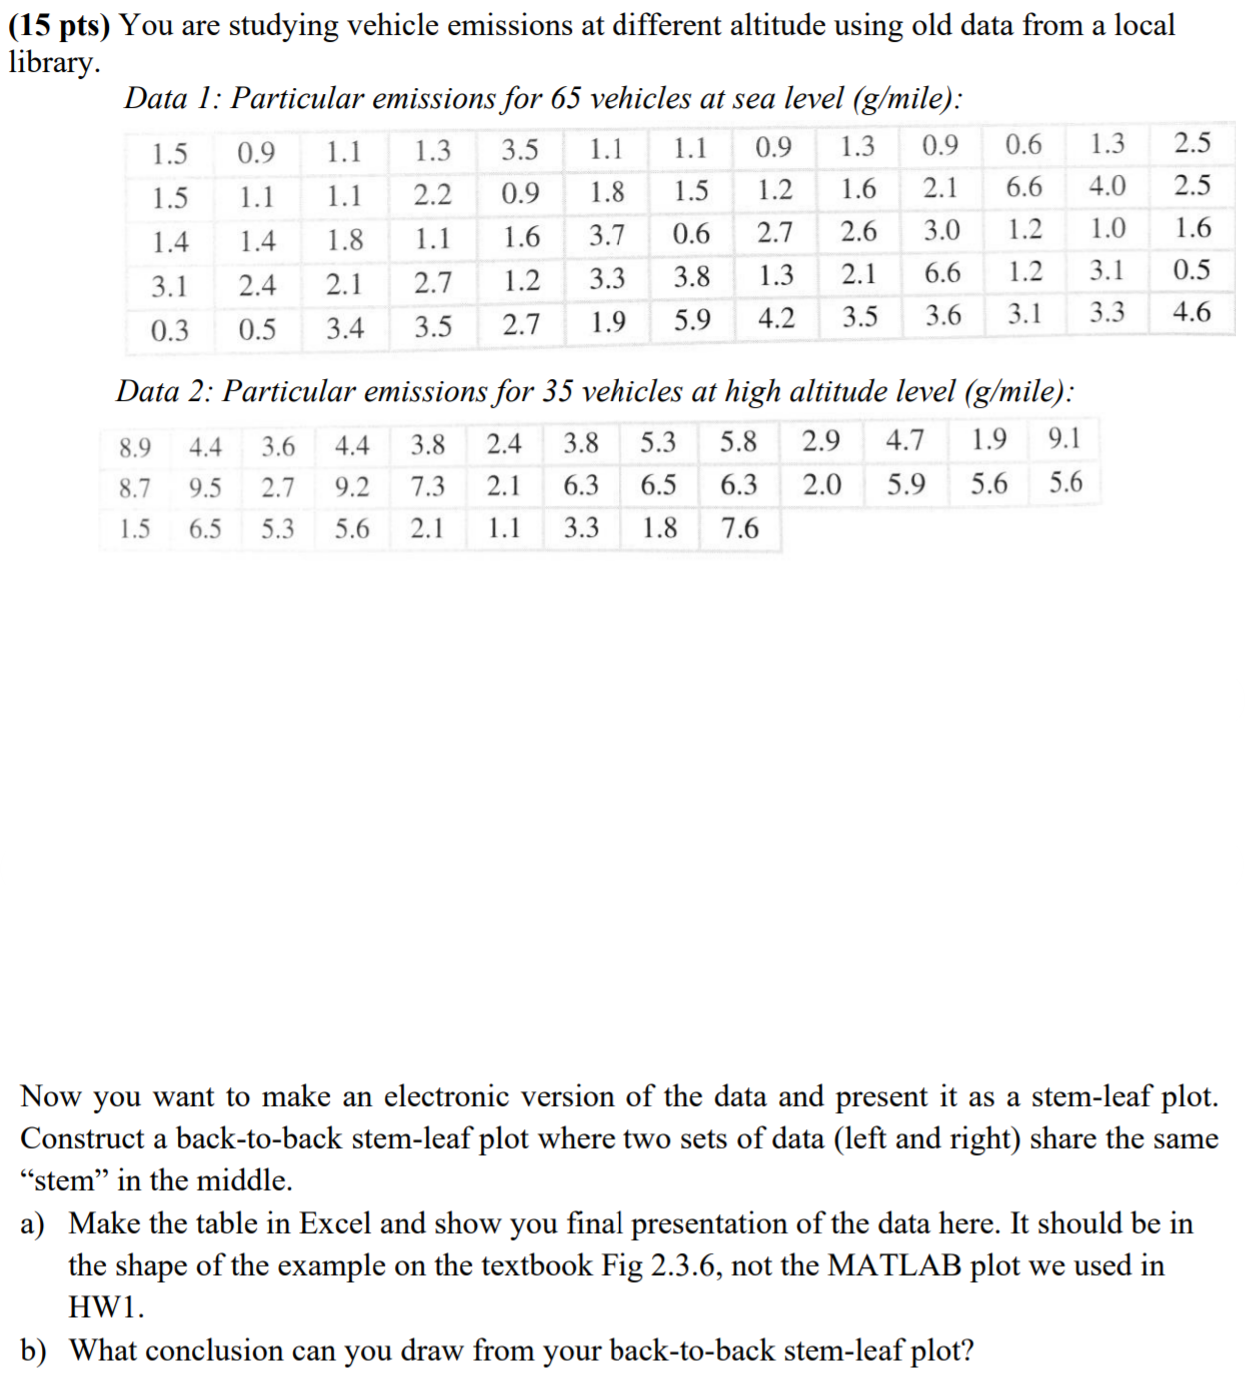
Stem Leaf W 04577888899 4 0022333333444444455566666677777788888889999999 5 0000000011112222223333333333333333344444444444555666666777777788999999 6 000011111111111222222233444444556666667888999 7 0111111123567888 8 2 FIGURE 2.3.6 Stem-and-leaf display of ages of 189 subjects shown in Table 2.2.1 (stem unit = 10, leaf unit = 1).(15 pts) You are studying vehicle emissions at different altitude using old data from a local libr . ary Data 1 : Particular emissions for 65 vehicles at sea level (g/mile): 1.5 0.9 1.1 1.3 3.5 1.1 1.1 0.9 1.3 0.9 0.6 1.3 2.5 1.5 1.1 1.1 2.2 0.9 1.8 1.5 1.2 1.6 2.1 6.6 4.0 2.5 1.4 1.4 1.8 1.1 1.6 3.7 0.6 2.7 2.6 3.0 1.2 1.0 1.6 3.1 2.4 2.1 2.7 1.2 3.3 3.8 1.3 2.1 6.6 1.2 3.1 0.5 0.3 0.5 3.4 3.5 2.7 1.9 5.9 4.2 3.5 3.6 3.1 3.3 4.6 Data 2: Particular emissions for 35 vehicles at high altitude level (gr/mile): 8.9 4.4 3.6 4.4 3.8 2.4 3.8 5.3 5.8 2.9 4.7 1.9 9.1 8.7 9.5 2.7 9.2 7.3 2.1 6.3 6.5 6.3 2.0 5.9 5.6 5.6 1.5 6.5 5.3 5.6 2.1 1.1 3.3 1.8 7.6 Now you want to make an electronic version of the data and present it as a stem-leaf plot. Construct a back-toback stem-leaf plot where two sets of data (left and right) share the same \"stern\" in the middle. a) Make the table in Excel and show you nal presentation of the data here. It should be in the shape of the example on the textbook Fig 2.3.6, not the MATLAB plot we used in HW]. b) What conclusion can you draw from your back-to-back stem-leaf plot
Step by Step Solution
There are 3 Steps involved in it

Get step-by-step solutions from verified subject matter experts